There is nothing in particular wrong with your code. Even without changing to SetDelayed (:=) I get a plot from it.

However all of the lines are plotting in the same colour. This is a well-known issue (and common beginner’s glitch), fixed by wrapping Evaluate around the things to be plotted.
Plot[Evaluate[y3[t]], {t, 0, 2*Pi}]

But it looks like just one line still. A close examination of the parameters shows that the differences between the elements of y3 are very small.
{3.71355 Cos[0.0134481 + 5 t] + 0.651072 Cos[0.0779878 + 5 t],
 3.71355 Cos[0.0066203 + 5 t] + 0.651072 Cos[0.0225695 + 5 t],
 3.71355 Cos[0.0155098 + 5 t] + 0.651072 Cos[0.0742136 + 5 t],
 0.651072 Cos[0.0343072 + 5 t] + 3.71355 Cos[0.088539 + 5 t]}
If, for example, you changed y2 to be
y2[t_] = RandomReal[{.1, 4}]*Cos[5 t + RandomReal[3, 4]]
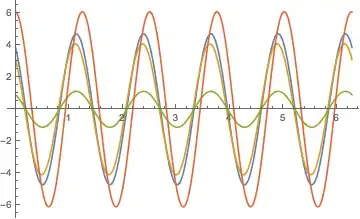
you would get more variation:
Plot[Evaluate[y3[t]], {t, 0, 2*Pi}]
The other thing I'd note is that you are using RandomReal[{0.1,4}] in the first element of your y1 and y2 definitions, which gives you a single number in the range [0.1,4], for each of your four ultimate series, and RandomReal[0.1,4] in the second element, which gives four separate random numbers. Changing them both to be RandomReal[0.1,4] will also give more variation.
In[76]:= y1[t_] = RandomReal[.1, 4]*Cos[5 t + RandomReal[.1, 4]]
y2[t_] = RandomReal[.1, 4]*Cos[5 t + RandomReal[.1, 4]]
y3[t_] = y1[t] + y2[t]

Out[76]= {0.0741471 Cos[0.0957893 + 5 t],
 0.00954211 Cos[0.0711904 + 5 t], 0.081582 Cos[0.0091461 + 5 t],
 0.00601038 Cos[0.0640423 + 5 t]}

Out[77]= {0.0356967 Cos[0.081578 + 5 t],
 0.0756288 Cos[0.0436748 + 5 t], 0.0493778 Cos[0.0118495 + 5 t],
 0.0762206 Cos[0.0472008 + 5 t]}

Out[78]= {0.0356967 Cos[0.081578 + 5 t] +
  0.0741471 Cos[0.0957893 + 5 t],
 0.0756288 Cos[0.0436748 + 5 t] + 0.00954211 Cos[0.0711904 + 5 t],
 0.081582 Cos[0.0091461 + 5 t] + 0.0493778 Cos[0.0118495 + 5 t],
 0.0762206 Cos[0.0472008 + 5 t] + 0.00601038 Cos[0.0640423 + 5 t]}

Plot[Evaluate[y3[t]], {t, 0, 2*Pi}]

As for why you are getting an empty plot, I can only surmise that either (a) you are defining one of y1, y2 and y3 as something other than a function earlier on in your code, or (b) there is some spacing issue in your actual version of the code. Try splitting each line up into a separate cell. (I am using version 10.0.1 and can’t rule out that earlier versions handled spacing glitches differently.)
SetDelayed[]as inClearAll["Global\"];y1[t_] := RandomReal[{.1, 4}]Cos[5 t + RandomReal[.1, 4]]; y2[t_] := RandomReal[{.1, 4}]*Cos[5 t + RandomReal[.1, 4]]; y3[t_] := y1[t] + y2[t];` – Dr. belisarius Sep 19 '14 at 22:33