I am working with mathematica 9.0 and I want to make a plot importing data from a .dat file. My issue is that I don't know how to show y axis in scientific notation. My values run from 0 to approx 4000 in the y axis. Can anybody help me? thank you
Asked
Active
Viewed 2,855 times
1 Answers
3
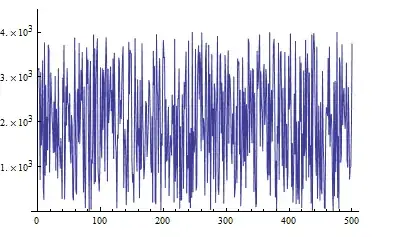
fakedata = Transpose[{Range[500], RandomReal[4000, {500}]}];
ListLinePlot[fakedata,
 Ticks -> {Automatic, {#, ScientificForm@#} & /@  Range[0., 4000., 1000.]},
 PlotRange -> {0, 4500}]
kglr
- 394,356
- 18
- 477
- 896
-
that doesn't work. Basically I have a .dat of 500 points and when I listlineplot it the y axis runs from 0 to 4000, and the only thing I want is to show 4x10^3 instead of 4000 – user25578 Sep 22 '14 at 11:48
-
-
Thank you, now the ticks are how I wanted, but now I am not able to write the axes labels – user25578 Sep 22 '14 at 14:11
-
-
Yes, now I've tried AxesLabel and it works. I was using FrameLabel. It's not possible to write frame labels in scientific notation? Thank you for your help – user25578 Sep 22 '14 at 14:19
-
-
When Frame is true, it does not work.
Then, one needs to use FrameTicks, instead of Ticks.
– PoreyS Sep 08 '22 at 00:26