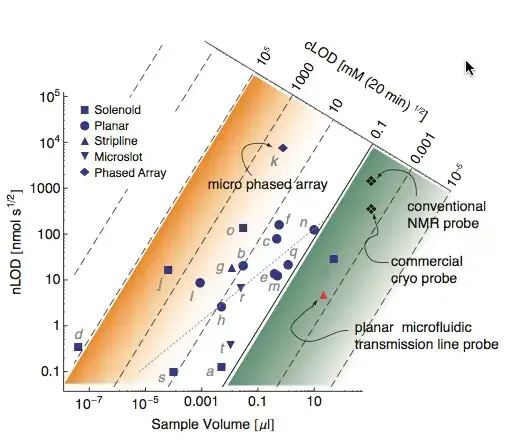
We are trying to plot a figure as below from data points. This version is a postprocessed plot (in Illustrator) just to obtain the skew axes. The rest is plotted with ListLogLogPlot. Any idea on how to add the "mixed" axes would be most appreciated!