This barchart was tricky to style, and I had to resort to the legacy BarCharts`package. Any ideas how to omit the labels from the bottom edge? Ideally I'd also like separator ticks between the column pairs.
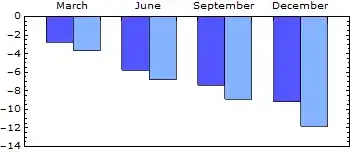
data = {{-2.8, -5.8, -7.4, -9.2}, {-3.7, -6.8, -8.9, -11.8}};

colour1 = RGBColor[82/255, 85/255, 255/255];
colour2 = RGBColor[132/255, 178/255, 255/255];

Quiet[Needs["BarCharts`"]]

BarChart[data, Frame -> True, AxesOrigin -> {0, 0},
 PlotRange -> {{0.525, 4.825}, {-14, 0}},
 BarLabels -> {"March", "June", "September", "December"},
 BarGroupSpacing -> 0.3, BarSpacing -> 0,
 BarStyle -> {colour1, colour2},
 BaseStyle -> {10, FontFamily -> "Verdana"}, AspectRatio -> 0.4,
 ImageSize -> 350]


PlotRange -> {All, {-0.25, -12}}removes the little gap between the boxes and the x-axis. edit: it kills the labels, though, oops. – s0rce May 30 '12 at 03:12PlotRangePaddingtoo. – Chris Degnen May 30 '12 at 12:38PlotRangePadding– rm -rf May 30 '12 at 14:17