3

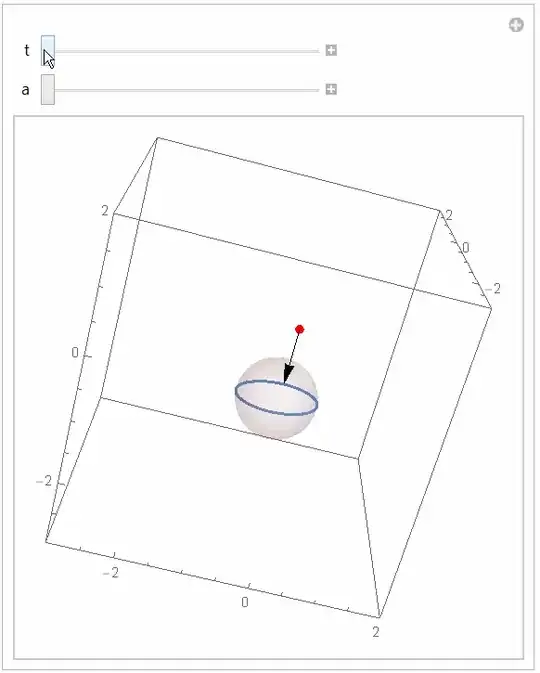
I have a vector $<x(t),y(t),z(t)>$ constrained to a unit sphere. I am trying to plot what the vector looks like as time progresses. What would be the easiest approach to visualizing this?

I have

x[t_, α_] := -1/Sqrt[1 + α^2]  Sin[ t Sqrt[1 + α^2]]
y[t_, α_] := -α/(1 + α^2) (Cos[t Sqrt[1 + α^2]] - 1)
z[t_, α_] := -1 - (1 - Cos[t Sqrt[1 + α^2]])/(1 + α^2)

I want to plot the vector as a function of t [0,10] and I guess alpha=1.

Mr.Wizard
  • 271,378
  • 34
  • 587
  • 1,371
yankeefan11
  • 391
  • 3
  • 8

2 Answers2

7
Manipulate[Show[Graphics3D[{
    {Red, PointSize[0.02], Point[{{0, 0, 0}}]},
    {Opacity[0.2], 
     Sphere[{0, a/(1 + a^2), -1 - 1/(1 + a^2)}, 1/Sqrt[1 + a^2]]}, 
    Arrow[{{0, 0, 0}, {x[t, a], y[t, a], z[t, a]}}]}], 
  ParametricPlot3D[{x[u, a], y[u, a], z[u, a]}, {u, 0, 10}], 
  Axes -> True, PlotRange -> Table[{-3, 2}, {3}]], {t, 0, 10}, {a, 1, 
  4}]

enter image description here

ubpdqn
  • 60,617
  • 3
  • 59
  • 148
5

You can use ParametricPlot3D for this kind of plot. Use Graphics3D if you want to visualize the sphere too.

Show[
 ParametricPlot3D[{x[t, 1], y[t, 1], z[t, 1]}, {t, 0, 10}, 
  PlotStyle -> {Red, Thick}, PlotRangePadding -> 0.31],
 Graphics3D[{Opacity[0.5], Sphere[{0.0, 0.5, -1.5}, 1/Sqrt[2]]}]
 ]

enter image description here

paw
  • 5,650
  • 23
  • 31