Could anybody explain, how the coordinates in Placed influence each other?
ArrayPlot[RandomInteger[10, {400, 400}],
ColorFunction -> "ThermometerColors",
PlotLegends -> {Placed[
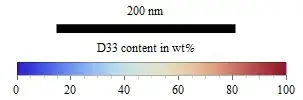
BarLegend[{"ThermometerColors", {0, 100}},
LabelStyle -> Directive[Black, FontSize -> 12],
LegendLabel -> "D33 content in wt%",
LegendMarkerSize -> 300], {{.35, -.65}, {-0, -3.}}],
Placed[Graphics[{Thickness[0.05], Line[{{0, 25}, {10, 25}}],
Text[Style["200 nm", Black, FontSize -> 12], {10/2, 26}]}], {{0,
0}, {-1, 3.}}]}]
Which gives:

EDIT:
I would like to have the black bar on the left hand side and the legend on the right hand side, below the arrayplot. I the alignment should be horizontally, not vertically.