48

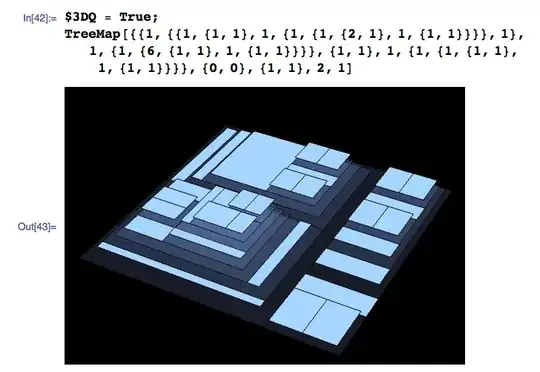
I've written the standard version of a tree map (a graphic that shows nested data) and I'm looking to improve on this layout by switching to different types of polygons or perhaps circles. Can anyone see a way to adapt this code in the style of a Voronoi diagram or otherwise?

enter image description here

enter image description here

Here is the code:

$buf = .05; $3Dbuf = .1; $3DQ = True;
ToList[x_List] := x;
ToList[x_] := {x};
FlatJoin[list___] := Join @@ (ToList /@ {list});
Second[x_] := x[[2]];

$frameStyle = Sequence[EdgeForm[Directive[Opacity[0.6], Black, Thin]], GrayLevel[.7], Opacity[.1]];
$leafStyle = Sequence[EdgeForm[Directive[Black, Thin]], GrayLevel[1], Opacity[1]];

    drawRectangle[{p1_, p2_}, area_List, max_, depth_] /; Length[area] > 1 := 
    {{$frameStyle, 
     If[$3DQ, Cuboid[Append[p1, depth], Append[p2, depth]], Rectangle[p1, p2]]},
    {First @ TreeMap[area, (1-$buf)p1 + $buf p2, (1-$buf)p2 + $buf p1, max, depth + $3Dbuf]}};

    drawRectangle[{p1_, p2_}, _, max_, depth_] := {$leafStyle, 
      If[$3DQ, Cuboid[Append[p1, depth], Append[p2, depth]], Rectangle[p1, p2]]};


    TreeMap[areas2_, lowerLeft2_, upperRight_, max_, depth_:0] := Module[
        {
            width, height, area, aspectRatio, fixedLengthDirection,
            fittedAreas, i, j, varLength, fixedLength, incs, last,
            aspectRatios, incsPts, lowers, uppers, layout, vl, recs,
            prims, lowerLeft, areas, areas1
        },

        prims = {};
        areas1 = areas2 / Total[areas2, {1, Infinity}] * Apply[Times, upperRight - lowerLeft2];
        areas = Total[areas1, {2,Infinity}];
        lowerLeft = lowerLeft2;
        For[j = 1, j <= Length[areas], Null,

        {width, height} = Subtract[upperRight, lowerLeft];
        area = width * height;
        aspectRatio = width / height;

        If[aspectRatio < 1,
            fixedLength = width;
            fixedLengthDirection = "Horizontal",
            fixedLength = height;
            fixedLengthDirection = "Vertical"
        ];

        If[j == Length[areas], 
            AppendTo[prims,  drawRectangle[{lowerLeft, upperRight}, Last @ areas1, max, depth]]; Break[]];

        For[i = j, i <= Length[areas], i++,
            fittedAreas = areas[[j;;i]];
            varLength = Total[fittedAreas] / fixedLength;
            incs = fittedAreas / varLength;
            If[i > 1 && Max[varLength / incs] >= max, Break[]];
            layout = {varLength, incs, areas1[[j;;i]]};
        ];
        j = i;

        If[fixedLengthDirection === "Vertical",
            incsPts = FlatJoin[Second[lowerLeft], Second[lowerLeft] + Accumulate[layout[[2]]]];
            lowers = Thread[{First[lowerLeft], Most[incsPts]}];
            uppers = Thread[{First[lowerLeft] + layout[[1]], Rest[incsPts]}];
            recs = Transpose[{lowers, uppers}]
        ,
            incsPts = FlatJoin[First[lowerLeft], First[lowerLeft] + Accumulate[layout[[2]]]];
            lowers = Thread[{Most[incsPts], Second[lowerLeft]}];
            uppers = Thread[{Rest[incsPts], Second[lowerLeft] + layout[[1]]}];
            recs = Transpose[{lowers, uppers}]
        ];

        AppendTo[prims, MapThread[
            drawRectangle[##, max, depth]&, {recs, layout[[3]]}]];
            lowerLeft = If[fixedLengthDirection === "Vertical",
            {First[lowerLeft] + layout[[1]], Second @ lowerLeft}, 
            {First @ lowerLeft, Second[lowerLeft] + layout[[1]]}
        ];
        ];

         If[$3DQ, Graphics3D[#, Boxed -> False, 
            Background -> Black]&, Graphics][{prims}]
    ];
Dr. belisarius
  • 115,881
  • 13
  • 203
  • 453
M.R.
  • 31,425
  • 8
  • 90
  • 281
  • 12
    I'm glad you weren't disheartened by the reception and closure (and deletion) of your previous post on treemaps, and made an effort on the code (actually, a working implementation) — a hearty +1 for that! I wish more new users were like this :) – rm -rf Jun 03 '12 at 06:13
  • Thanks @R.M. I found a good explanation of basic algorithm here: http://www.win.tue.nl/~vanwijk/stm.pdf – M.R. Jun 03 '12 at 06:18
  • 1
    FlatJoin seems like a strange function; could you not write FlatJoin[list___] := Flatten[{list}, 1]? – Mr.Wizard Jun 03 '12 at 06:31
  • Yes, that is much better, thanks. – M.R. Jun 03 '12 at 06:40
  • This maybe useful: http://demonstrations.wolfram.com/Treemap/ I am not sure if you seen this. – Vitaliy Kaurov Jun 03 '12 at 14:54
  • I did see that demo, but the code I have above is already much better for a few reasons: it is not a hard coded example, it is a usable function that take nested data as input, it uses squarified not slice and dice... – M.R. Jun 04 '12 at 17:41
  • 2
    You could try using RLink as there are some nice Treemap plotting packages in R. There is some R code here you could implement (if you have Windows http://mathematica.stackexchange.com/questions/15373/installing-cran-packages): https://www.stat.auckland.ac.nz/~paul/Reports/VoronoiTreemap/voronoiTreeMap.html#sec-rawcode – Jonathan Shock Mar 20 '13 at 05:27

1 Answers1

9

It's not a TreeMap using non-rectangles. But maybe can inspire someone to go beyond. I believe that I get a nice squarification using this article suggested by @M.R.

The code is for Mathematica V10, and can be tested in the WolframCloud. I played with Associations and some others new MMA funcitons as Area and the new @* notation.

(*Test Function*)
$testArea=Normalize[Reverse@Sort@RandomReal[300,10],N@*Total];
drawRec[rec_List]:=Graphics[{EdgeForm[Thin],RandomColor[RGBColor[_,1,NormalDistribution[.1,.1]]],Tooltip[Rectangle@@#,RandomInteger[1000]]}&/@rec]

(*Create Frame*)
createFrame[ass_Association]:=createFrame[ass["orgFrame"],ass["areas"]]
createFrame[orgFrame:{{orgX1_,orgY1_},{orgX2_,orgY2_}},area_List]:=
  Module[{orgX=Abs[orgX2-orgX1],orgY=Abs[orgY2-orgY1],totalArea=N@Total@area,newX,newY,nextFrame,hForm,worstDiv,worstX,worstY},

    (*discovery original frame form*)
    hForm=If[orgX>orgY,True,False];

    (*calculate new frame dimensions, based on informed areas*)
    If[hForm
        ,newY=orgY;newX=totalArea/orgY
        ,newX=orgX;newY=totalArea/orgX
    ];

    (*calculate worst area dimensions*)
    If[hForm
        ,worstX=newX;worstY=Last@area/newX;
        ,worstY=newY;worstX=Last@area/newY
    ];

    (*return data*)
    <|
      "orgFrame"-> orgFrame
     ,"newFrame"-> {{orgX1,orgY1},{orgX1,orgY1}+{newX,newY}}
     ,"nextFrame"-> {{orgX1,orgY1}+If[hForm,{newX,0},{0,newY}],{orgX2,orgY2}}
     ,"areas"->area
     ,"worstDivRatio"-> Abs[worstX-worstY]
    |>
]
(*t=createFrame[{{0,0},{1.5,1/1.5}},$testArea]*)


(*Find Best Section Partition*)
findBestSector[orgFrame_List,orgArea_List]/;Length@orgArea==1:=createFrame[orgFrame,orgArea]
findBestSector[orgFrame_List,orgArea_List]/;Length@orgArea>=2:=Module[{r={},i,f1,f2,nextArea},
    For[i=1,i<Length@orgArea,i++,
        f1=createFrame[orgFrame,orgArea[[;;i]]];
        f2=createFrame[orgFrame,orgArea[[;;i+1]]];
        If[f2["worstDivRatio"]>f1["worstDivRatio"],r=f1;Break[]];
        r=f2;
    ];
    r["nextArea"]=orgArea[[i+1;;-1]];
    r
]
(*findBestSector[{{0,0},{1.5,1/1.5}},$testArea]*)

(*Find All Sectors*)
findSectors[frameData_Association]:=Module[{r},
    r=findBestSector[frameData["orgFrame"],frameData["areas"]];
    If[Not@KeyExistsQ[r,"nextArea"]||r["nextArea"]==={}
        ,r
        ,Flatten@{r,findSectors[<|"orgFrame"->r["nextFrame"],"areas" -> r["nextArea"]|>]}
    ]
]

(*r=findSectors[\[LeftAssociation]"orgFrame"\[Rule]{{0,0},{1.5,1/1.5}},"areas"\[Rule]$testArea\[RightAssociation]];*)
(*drawRec[r\[LeftDoubleBracket]All,"newFrame"\[RightDoubleBracket]]*)


(*Filling Sector with Squares*)
fillSector[ass_Association]:=fillSector[{ass["orgFrame"],ass["areas"]}]
fillSector[{{{orgX1_,orgY1_},{orgX2_,orgY2_}},areas_List}]:=
  Module[{orgX=Abs[orgX2-orgX1],orgY=Abs[orgY2-orgY1],hForm,frameBase},

    (*discovery original frame form*)
    If[orgX>orgY
        ,frameBase={{#1,0},{#2,orgY}}&@@@Partition[Accumulate@Prepend[areas/orgY,0],2,1]
        ,frameBase={{0,#1},{orgX,#2}}&@@@Partition[Accumulate@Prepend[areas/orgX,0],2,1]
    ];

    Map[#+{orgX1,orgY1}&,frameBase,{-2}]
]
(*r=findSectors[\[LeftAssociation]"orgFrame"\[Rule]{{0,0},{1.5,1/1.5}},"areas"\[Rule]$testArea\[RightAssociation]];*)
(*fFrame=fillSector[{r\[LeftDoubleBracket]1,"newFrame"\[RightDoubleBracket],r\[LeftDoubleBracket]1,"areas"\[RightDoubleBracket]}]*)
(*drawRec@fFrame*)

(*treeMapPlot!*)
treeMapPlot[areas_List,frame:{{x1_,y1_},{x2_,y2_}}:{{0,0},{N@GoldenRatio,1}}]:=Module[{r,frameArea},
    frameArea=Area@*Rectangle@@frame;
    r=findSectors[<|"orgFrame"->frame,"areas"->frameArea*Normalize[Reverse@Sort@areas,Total]|>];
    r=Flatten[fillSector/@Values@r[[All,{"newFrame","areas"}]],1];
    Graphics[{EdgeForm[Thin],RandomColor[RGBColor[_,1,NormalDistribution[.1,.1]]],Rectangle@@#}&/@r]
]
area=RandomReal[1,100];
treeMapPlot[area]

This is an example with 100 squares.

100 Squares

This other has 10k squares.

10k Squares

Possible improvements are: Labels, Tooltips, Color Control and Depth Options.

Mr.Wizard
  • 271,378
  • 34
  • 587
  • 1,371
Murta
  • 26,275
  • 6
  • 76
  • 166