10

I am trying to plot a simple function

F[x_, y_] := 1/x If[y < x^2 + 2 x && y > Abs[x^2 - 2 x], 1 - 1/4 (x - y/x)^2, If[y > 0 && y < -x^2 + 2 x, y, 0]]

in a simple way:

g1 = Plot3D[F[x, y], {x, 0, 2.5}, {y, 0, 11}, BoxRatios -> {3, 3, 2.2},PlotPoints ->{30, 30}, PlotRange -> {0, 1.5}, MeshFunctions -> {#1 &}, Lighting -> "Neutral", Filling -> Bottom, FillingStyle -> Opacity[1]];
g2 = Plot3D[F[x, y], {x, 0, 2.5}, {y, 0, 11}, BoxRatios -> {3, 3, 2.2},PlotPoints -> {30, 30}, PlotRange -> {0, 1.5}, MeshFunctions -> {#1 &}, Lighting -> {{"Ambient", White}}, Filling -> Bottom, FillingStyle -> Opacity[1]];
gr = GraphicsRow[ Show[#, Boxed -> False, Axes -> None, ViewPoint -> {1.8, 2.5, 1.3}] & /@ {g1, g2}, ImageSize -> Full]

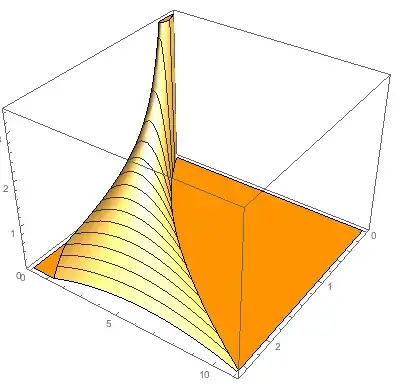
and find a lot of artefacts, see below:

2 plots

The problems I marked here can be reduced somehow by increasing the number of PlotPoints. However, I never manage to get rid of them (artefacts, not points) completely. Most disturbing things are:

  • A curve running across the plane (on both plots). As I understood there should only the Mesh lines be visible;
  • Discontinuous vertical line in the second plot;
  • Strange shadows on the top of first plot.

Any help is greatly appreciated.

yarchik
  • 18,202
  • 2
  • 28
  • 66
  • 1
    Using the option MaxRecursion -> 10 greatly reduces the problem – rhermans Oct 23 '14 at 18:25
  • yarchik, do you get what you need if you use PlotPoints -> {80, 80}, BoundaryStyle -> None, MaxRecursion -> 5 (or higher values for PlotPoints and MaxRecursion)? – kglr Oct 23 '14 at 18:33
  • 1
    I recommend that you define F using Piecewise rather than If: F[x_, y_] := Piecewise[{{(1 - 1/4 (x - y/x)^2)/x, y < x^2 + 2 x && y > Abs[x^2 - 2 x]}, {y/x, y > 0 && y < -x^2 + 2 x}}]. Note that Maximize[{F[x, y], 0 <= x <= 2.5, 0 <= y <= 11}, {x, y}] gives {1.97433, {x -> 0.0256689, y -> 0.050679}}. Since the maximum is greater than your specified PlotRange, you are clipping the Plot and causing the artifact near the maximum. Use PlotRange -> All – Bob Hanlon Oct 23 '14 at 18:56
  • I would like to comment on these suggestions and on the answer from @rhermans and Craig Carter. They are not satisfactory as they address only minor issues and do not solve the main problem of removing the curved line in the x-y plane. – yarchik Oct 24 '14 at 13:15
  • @Bob Hanlon My PlotRange was chosen intensionally. I do prefer to have clipping. – yarchik Oct 24 '14 at 13:17
  • On my Mac with Mma 10.0.1, the curve running across the plane can be removed by using the option ClippingStyle -> None. – Bob Hanlon Oct 24 '14 at 14:44

2 Answers2

12

This behaves better with a RegionFunction:

p1 =
 Plot3D[(1 - 1/4 (x - y/x)^2)/x, { x, 0, 2.5}, {y, 0, 11}, 
  BoxRatios -> {3, 3, 2.2}, PlotPoints -> {30, 30}, 
  PlotRange -> {0, 3.5}, MeshFunctions -> {#1 &}, 
  Lighting -> "Neutral", ClippingStyle -> Opacity[1]]

p2 =
 Plot3D[0.00001, { x, 0, 2.5}, {y, 0, 11}, BoxRatios -> {3, 3, 2.2}, 
  PlotPoints -> {30, 30}, PlotRange -> {0, 1.5}, 
  MeshFunctions -> {#1 &}, Lighting -> "Neutral", Filling -> Bottom, 
  FillingStyle -> Opacity[1],
  RegionFunction -> 
   Function[{x, y}, ! (y < x^2 + 2 x && y > Abs[x^2 - 2 x] ) ]
  ]

Show[p1, p2]

result of Show with a Region Function

But, I think this is more appealing:

Plot3D[(1 - 1/4 (x - y/x)^2)/x, { x, 0, 2.5}, {y, 0, 11}, 
 BoxRatios -> {3, 3, 2.2}, PlotPoints -> {30, 30}, 
 PlotRange -> {0, 3.5}, MeshFunctions -> {#1 &}, 
 Lighting -> "Neutral", ClippingStyle -> Orange]

Result of color for clippingstyle

Craig Carter
  • 4,416
  • 16
  • 28
  • I think you made a mistake in defining the function. There are two different domains. Concerning the use of color, I do not think it conveys some additional information. I am for puristic style. – yarchik Oct 24 '14 at 13:22
11

Using the option MaxRecursion -> 8 greatly reduces the problem in a better way than PlotPoints as points are added only in the regions where is needed i.e. with big first and second derivatives.

Here is with an overkill of MaxRecursion -> 12 and WorkingPrecision -> 22 just to be sure.

g1 = Plot3D[F[x, y], {x, 0, 2.5}, {y, 0, 11}, 
   BoxRatios -> {3, 3, 2.2}, PlotPoints -> {30, 30}, 
   PlotRange -> {0, 1.5}, MeshFunctions -> {#1 &}, 
   Lighting -> "Neutral", Filling -> Bottom, 
   FillingStyle -> Opacity[1], MaxRecursion -> 12, 
   WorkingPrecision -> 22];
g2 = Plot3D[F[x, y], {x, 0, 2.5}, {y, 0, 11}, 
   BoxRatios -> {3, 3, 2.2}, PlotPoints -> {30, 30}, 
   PlotRange -> {0, 1.5}, MeshFunctions -> {#1 &}, 
   Lighting -> {{"Ambient", White}}, Filling -> Bottom, 
   FillingStyle -> Opacity[1], MaxRecursion -> 12, 
   WorkingPrecision -> 22];
gr = GraphicsRow[
  Show[#, Boxed -> False, Axes -> None, 
     ViewPoint -> {1.8, 2.5, 1.3}] & /@ {g1, g2}, ImageSize -> Full]

enter image description here

rhermans
  • 36,518
  • 4
  • 57
  • 149
  • 1
    Thank you for your suggestions. MaxRecursion -> 12 and WorkingPrecision -> 22 is indeed an overkill. Besides, it does not remove the curve in x-y plane, it just makes it smooth. I wonder what is its origin? – yarchik Oct 24 '14 at 13:20