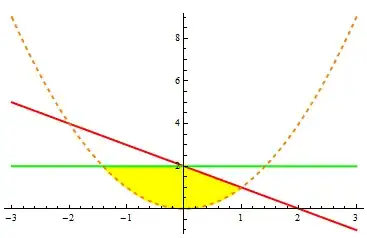
Plot[{ConditionalExpression[x^2, x^2 <= Min[2, 2 - x]], Min[2, 2 - x],2 - x, 2, x^2}, {x, -3, 3},
 Filling -> {1 -> {2}}, FillingStyle -> Yellow,
 PlotStyle -> {Directive[{Opacity[1], Yellow}], Opacity[0],
   Directive[{Opacity[1], Red}], Green, Directive[{Dashed, Orange}]}, BaseStyle -> Thick]
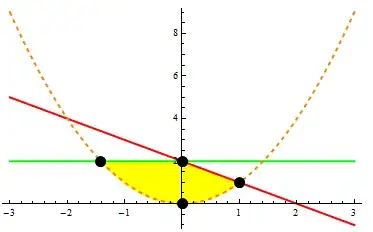
Use MeshFunctions and Mesh to add the intersection points
Plot[{ConditionalExpression[x^2, x^2 <= Min[2, 2 - x]], Min[2, 2 - x],
   2 - x, 2, x^2}, {x, -3, 3},
 Filling -> {1 -> {2}}, FillingStyle -> Yellow,
 Mesh -> {{0}, {0}}, MeshStyle -> PointSize[.03],
 MeshFunctions -> {# &, ConditionalExpression[Min[2, 2 - #] - #^2, #2 + # <= 2 && #2 <= 2] &},
 PlotStyle -> {Directive[{Opacity[1], Yellow}], Opacity[0],
   Directive[{Opacity[1], Red}], Green, Directive[{Dashed, Orange}]},
 BaseStyle -> Thick]
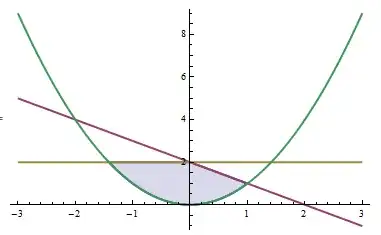
ParametricPlot[{ConditionalExpression[{x, v x^2 + (1-v) Min[2, 2 - x]}, x^2 <= Min[2, 2 - x]],
 {x, 2 - x}, {x, 2}, {x, x^2}}, {x, -3, 3}, {v, 0, 1},
 AspectRatio -> 1/GoldenRatio, PlotStyle -> ColorData[1, "ColorList"],
 BaseStyle -> Thick, Frame -> False, Axes -> True, Mesh -> None]

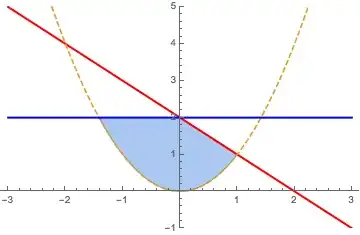


Show[ RegionPlot[y < 2 && y < 2 - x && y > x^2, {x, -2, 2}, {y, -1, 3}], Plot[{2 - x, x^2, 2}, {x, -3, 3}]]– Kuba Oct 27 '14 at 23:45Show[RegionPlot[Min[2, 2 - x] > y > x^2, {x, -2, 2}, {y, -1, 3}], Plot[{2 - x, x^2, 2}, {x, -3, 3}]]– Dr. belisarius Oct 28 '14 at 00:06