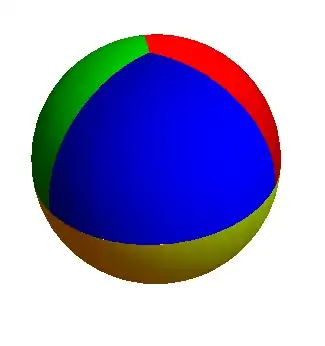
The problem: I would like to draw a sphere where the bottom half is one color, and the top half is split into 3 equal regions, each with its own color.
I have come up with the following code, by following the example from drawing a line on a torus here on Stack Overflow (Plotting a contour on a torus)
yourFunc = Function[{u, v}, v - Pi/2]
yourFunc2 = Function[{u, v}, u - 4 Pi/3]
yourFunc3 = Function[{u, v}, u - 2 Pi/3]
yourFunc4 = Function[{u, v}, u - 2 Pi]

ParametricPlot3D[{
    Cos[u] Sin[v], Sin[v] Sin[u], Cos[v]
}, {
    u, 0, 2 Pi
}, {
    v, 0, Pi
},
MeshFunctions -> {
    Function[{x, y, z, u, v}, yourFunc[u, v]],
    Function[{x, y, z, u, v}, yourFunc2[u, v]],
    Function[{x, y, z, u, v}, yourFunc3[u, v]],
    Function[{x, y, z, u, v}, yourFunc4[u, v]]
},
Mesh -> {{0}},
MeshShading -> {
    {{{Red}, {Green}, {Blue}, {Yellow}}},
    {{{Orange}, {Cyan}, {Magenta}, {Black}}},
    {{{White}, {Black}, {White}, {Black}}}
},
MeshStyle -> Directive[Green, Thick],
PlotPoints -> 100,
PlotStyle -> Opacity[3/5]
]
This will draw lines how I want it, but I have not been able to figure out how to draw each of the 4 regions with different colors. No matter how I played with it, I can only get 3. I've tried using MeshShading, as seen here, and also tried with a ColorFunction, but that didn't get me anything.
I hope that I'm making this more complicated than it has to be.


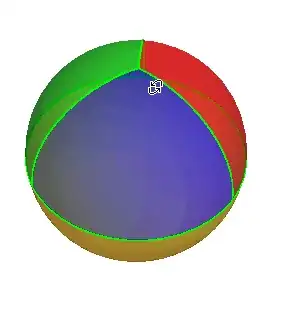


MeshShadingand progresses approach in question (so +1) The alternative of putting pieces together, which I used, seems easier to deal with (perhaps) unwanted 'longitude' lines, though I have to suppress the 0/2Pi seam of bottom hemisphere. :) – ubpdqn Nov 08 '14 at 02:19None. The thickness of the boundary hides the gaps.) You don't get gaps withMeshShading. (I hate that seam in the parametrized sphere - with or without the boundary. +1 to you, too) – Michael E2 Nov 08 '14 at 05:12