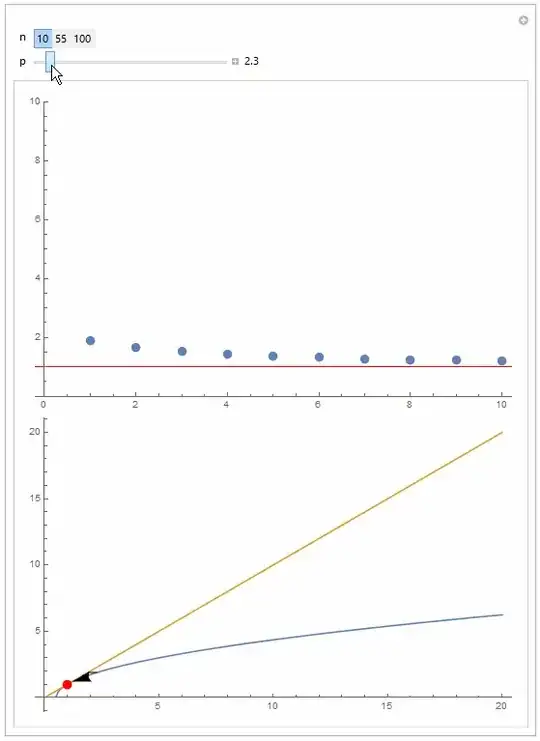
Just for fun you can visualize the rate of convergence for various starting position (and the monotony of approach to 1):
f[n_, p_] := Nest[Sqrt[2 # - 1] &, p, n]
Manipulate[
 Column[{DiscretePlot[f[j, p], {j, 1, n}, PlotRange -> {0, 10},
    GridLines -> {None, {1}}, GridLinesStyle -> Red, ImageSize -> 500],
   With[{ladder =
      Join @@ ({#, {Last@#, Last@#}} & /@
         Partition[f[#, p] & /@ Range[0, n], 2, 1])},
    Plot[{Sqrt[2 x - 1], x}, {x, 0, 20},
     Epilog -> {Arrow[ladder], {Red, PointSize[0.02], Point[{1, 1}]}},
      ImageSize -> 500]]
   }], {n, Range[10, 100, 45]}, {p, 1.1, 20, Appearance -> "Labeled"
  }]
NestList and ListPlot could have been used instead of DiscretePlot