this is my code:
In[76]:= sekprav =
Import["C:\\Users\\Mitja\\Documents\\prakiktum 5 in \
6\\sipanipravokotno.txt", "Table"]
Out[76]= {{0, 22}, {1, 25}, {2, 20}, {3, 23}, {4, 26}, {5, 19}, {6,
29}, {7, 26}, {8, 19}, {9, 23}, {10, 20}}
In[77]:= tsekprav =
Transpose[{sekprav[[All, 1]], sekprav[[All, 2]]/10}]
Out[77]= {{0, 11/5}, {1, 5/2}, {2, 2}, {3, 23/10}, {4, 13/5}, {5, 19/
10}, {6, 29/10}, {7, 13/5}, {8, 19/10}, {9, 23/10}, {10, 2}}
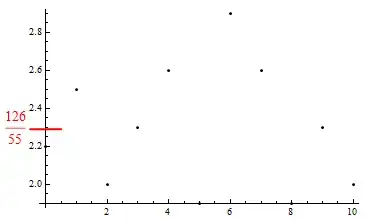
In[78]:= Show[ListPlot[tsekprav, PlotStyle -> Black],
Plot[Mean[tsekprav[[All, 2]]], {x, 0, 10}, PlotStyle -> Red],
PlotLabel ->
"Sipanje sekundarnih žarkov - pravokotno (\[CapitalDelta]t=10s)",
Axes -> {False, True}]
Out[78]= \!\(\*
GraphicsBox[{{{},
{GrayLevel[0], PointSize[0.019444444444444445`], AbsoluteThickness[
1.6], PointBox[{{0., 2.2}, {1., 2.5}, {2., 2.}, {3., 2.3}, {4.,
2.6}, {5., 1.9}, {6., 2.9}, {7., 2.6}, {8., 1.9}, {9., 2.3}, {
10., 2.}}]}, {}}, {{}, {},
{RGBColor[1, 0, 0], AbsoluteThickness[1.6], Opacity[1.],
LineBox[CompressedData["
1:eJxTTMoPSmViYGAwAWIQPbcuic0wpdsupMlG9UQwk8PDxHVib+V32sP41YHZ
Ca/lT8L5nD9nn8zRuwXnFx6q73lT9BjO11sy+eKWdS/h/Kd+GTL3LT7A+dOl
2mQXJnyG8y2LdqxnPvMNzj98fXZAvvovON+w55+dhOdfON/9mdV9g3AGBxj/
ue421y9vGOH86j+dxnuqmOF8dsEXmSFarHA+61lWd+69bHD+73NrcyYVcsD5
T8PXScrJccH5jh15uSfWcsP5U//t4HSO54Xzo2UO+9z5zAfn8xzQfqMUKgDn
p5ou+hqpIwjnl9dVBCl8RfBbX02+fO6cEJzvo8W/gmeWMJzfu9bsgE+iCJx/
KnjxnxJLUTj/wNn8Hh1mMTh/U1ajw5m7CL6ct71F3hZxON/5f0zz/BoJOD/l
2v5PO0Il4Xy7xqatiQpScP6k/I+7eZ4j+I8alj6bv08azn+dujPlULsMnP8h
V4j9bKIsnL/O8/SfNF05OP9ZhoEZ81cEX2r1rcntZ+Xh/OaEokVnvRXg/O9/
JHu9dyL4GrunzzylogjnmyYf9RfsRPAPzBGVOPMVwdc4INrlF60E5/uyvpG9
tA/B/3D7yeGTWspwfv6cXuHOfgRfzCOq7chxBH/fZ7Wf//8j+ABva0Ax
"]]}}},
AspectRatio->0.6180339887498948,
Axes->{False, True},
AxesLabel->{None, None},
AxesOrigin->{0, 1.8499999999999999`},
DisplayFunction->Identity,
Frame->{{False, False}, {False, False}},
FrameLabel->{{None, None}, {None, None}},
FrameTicks->{{Automatic, Automatic}, {Automatic, Automatic}},
GridLines->{None, None},
GridLinesStyle->Directive[
GrayLevel[0.5, 0.4]],
Method->{},
PlotLabel->FormBox[
"\"Sipanje sekundarnih žarkov - pravokotno (\[CapitalDelta]t=10s)\
\"", TraditionalForm],
PlotRange->{{0, 10.}, {1.9, 2.9}},
PlotRangeClipping->True,
PlotRangePadding->{{
Scaled[0.02],
Scaled[0.02]}, {
Scaled[0.05],
Scaled[0.05]}},
Ticks->{Automatic, Automatic}]\)
And the problem is, that I would somehow like to have the number on the mean value written on the graph. So is there perhaps a way I could create only ONE read Ticks at the mean value and also write the value next to it... I know about the Epilog, but I am just curious for any other options.

Thanks for all the help!