7

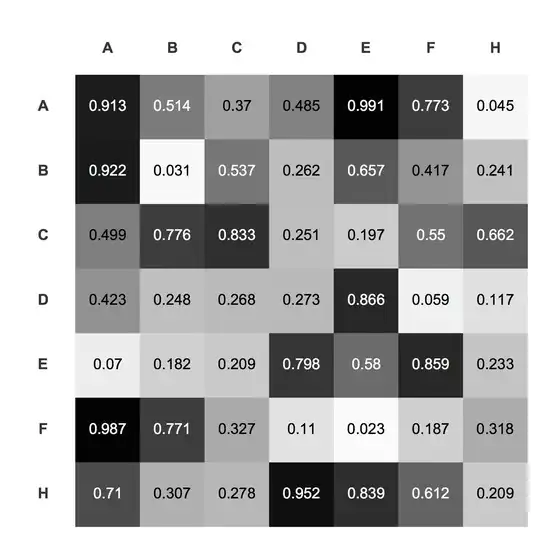
I'm trying to format a raster-style table with row and column headings and in which each cell is shaded according to the value in the cell, and the value of the cell is displayed in as text in a contrasting shade, for example

I can kludge something together that works:

drawTable[s_] := With[
  {
   probs = Reverse[Table[RandomReal[], {Length[s]}, {Length[s]}]]
   },
  Show[Graphics[
    Raster[
     Append[
      Transpose[Prepend[Transpose[1 - probs], Table[1, {Length[s]}]]],
       Table[1, {Length[s] + 1}]]
     ]
    ],
   Epilog -> { 
     Table[
      Text[Style[s[[i]], Bold, GrayLevel[0.2]], {0.5, 
        Length[s] - i + 0.5}], {i, Length[s]}],
     Table[
      Text[Style[s[[i]], Bold, GrayLevel[0.2]], {i + 0.5, 
        Length[s] + 0.4}], {i, Length[s]}],
     Table[ 
      {GrayLevel[If[# <= 0.5, 0, 1] &[probs[[i, j]]]], Text[
        If[# == 0 , "", #] &[Round[#, N[10^-3]] ] &[probs[[i, j]]],
        {.5 + j, -.5 + i}]
       },
      {i, Length[s]}, {j, Length[s]}]       
     }
   ]
  ]

drawTable[{"A", "B", "C", "D", "E", "F", "H"}]

But there has to be an easier way. I've arrived at positioning by quite a bit of trial and error, resulting in a quite a bit of appending, transposing and un-transposing, and tweaking of positions, and even then the result isn't perfect (for example there is extra blank space above and to the left).

Is there a better way to go about this, either strategically (what a different API) or tactically (being smarter about list handling, especially)?


FWIW, in the actual scenario, I need more control over the formatting of the digits and of the text used for the headings, so I expect Text and Style are needed.

orome
  • 12,819
  • 3
  • 52
  • 100

5 Answers5

7

Maybe this:

icol[r_, c_] := Item[Style[NumberForm[r, {4,3}], c], Background -> GrayLevel[r]];
item[r_Real /; 0 <= r <= 1] := If[r > 0.5, icol[r, Black], icol[r, White]];
Grid[Map[item, RandomReal[1, {4, 4}], {2}], 
  ItemStyle -> "Text", 
  ItemSize -> {5, 5}, 
  Alignment -> {Center, Center}]

enter image description here

To add the row and column headers:

Grid[
 MapThread[
 Join,
 {{{""}, {"A"}, {"B"}, {"C"}, {"D"}},
 Join[{{"A", "B", "C", "D"}},
  Map[item, RandomReal[1, {4, 4}], {2}]]}],
 ItemStyle -> "Text",
 ItemSize -> {5, 5},
 Alignment -> {Center, Center}]

enter image description here

Arnoud Buzing
  • 9,801
  • 2
  • 49
  • 58
7

You can avoid Item and do this by referencing the Grid positions directly in Background and ItemStyle:

SeedRandom[1];
tmp = RandomReal[{0, 1}, {4, 4}];

Now:

Grid[tmp,
 Alignment -> {Center, Center},
 Background -> {None, None,Flatten[MapIndexed[#2 -> GrayLevel[1 - #1] &, tmp, {2}], 1]},
 ItemSize -> {10, 5},
 ItemStyle -> {None, None,Flatten[MapIndexed[#2 -> If[#1 > 0.5, White, Black] &, tmp, {2}],1]}
]

enter image description here

Edit

Realised I forgot to add your headers.

labels = {"", "A", "B", "C", "D"};

Grid[Join[List /@ labels, Join[{Rest@labels}, tmp], 2],
 Alignment -> {{Right, {Center}}, {Bottom, {Center}}},
 Background -> {None, None,Flatten[MapIndexed[1 + #2 -> GrayLevel[1 - #1] &, tmp, {2}], 1]},
 ItemSize -> {All, 5},
 ItemStyle -> {None, None,Flatten[MapIndexed[1 + #2 -> If[#1 > 0.5, White, Black] &,tmp, {2}], 1]},
 Spacings -> {{0, {3}}, {0, {3}}}]

enter image description here

Mike Honeychurch
  • 37,541
  • 3
  • 85
  • 158
5
n = 7;
mat = Round[RandomReal[{0, 1}, {n, n}], 0.01];
ft = Transpose[{Range[n], Take[CharacterRange["A", "Z"], n]}];

ArrayPlot[
 mat,
 Epilog -> MapIndexed[Text[#1, #2 - 1/2] &, Transpose @ Reverse @ mat, {2}] /.
  Text[a_, b_] :> Text[Style[PaddedForm[a, {3, 2}], If[a > 0.5, White, Black]], b],
 FrameTicks -> {ft, ft},
 Mesh -> True,
 PlotTheme -> "Detailed",
 ImageSize -> 400]

enter image description here

ArrayPlot[
 Round[RandomReal[{-1, 1}, {4, 4}], 0.01],
 ColorFunction -> "RedGreenSplit",
 Epilog -> 
  MapIndexed[Text[Framed[#1, Background -> White], #2 - 1/2] &,
   Transpose @ Reverse @ mat, {2}],
 Mesh -> True,
 PlotTheme -> "Detailed",
 ImageSize -> 400]

enter image description here

eldo
  • 67,911
  • 5
  • 60
  • 168
  • If you change some ArrayPlot options (FrameTicks -> {{ft, None}, {None, ft}}, FrameTicksStyle -> Directive[Opacity[1], Black], FrameStyle -> Opacity[0]), you get an almost exact reproduction of OP's example! – Aisamu Nov 11 '14 at 17:50
2

Another way to use Graphics and Raster:

ClearAll[rF, tF, lF];
tF = Transpose[{Range[Length@#] - 1/2,Style[#, "Panel", 18] & /@ #}] &;
(* in some versions you might need Style[#, "Panel", 18, Background -> Transparent] & *)

lF = Text[Style[#, If[# <= .5, White, Black], "Panel", 16, Background -> Transparent],#2 - 1/2] &;

rF = With[{m = N@Round[RandomReal[1, {1, 1} Length@#], 1/100]},
    Graphics[{Raster[m], MapIndexed[lF, Transpose@m, {2}]},
     Frame -> True, FrameTicks -> {{tF@Reverse[#], None}, {None, tF@#}}]] &;

rF@RandomSample[CharacterRange["A", "Z"], 7]

enter image description here

Update: Just in case we want colors other than GrayLevel

lF2 = Text[Style[#, ColorData["TemperatureMap"][#], "Panel", 16, 
     Background -> Transparent], #2 - 1/2] &;

rF2 = With[{m = N@Round[RandomReal[1, {1, 1} Length@#], 1/100]}, 
    Graphics[{Raster[m, ColorFunction -> "TemperatureMap"], 
      MapIndexed[lF2, Transpose@m, {2}] /. 
       RGBColor -> Composition[Darker, Darker, RGBColor, Reverse[{##}] &]}, 
     Frame -> True, FrameTicks -> {{tF@Reverse[#], None}, {None, tF@#}}]] &;

rF2@RandomSample[CharacterRange["A", "Z"], 7]

enter image description here

kglr
  • 394,356
  • 18
  • 477
  • 896
  • (+1) It seems that you forgot Background -> Transparent in the definition for tF: I get gray background for the tick labels without it. – Alexey Popkov Nov 11 '14 at 12:22
  • @AlexeyPopkov, thank you. Ii think this may be a version/os issue; in version 9.0.1.0 (windows 8) it works as expected as is. I will add the option to tF. – kglr Nov 11 '14 at 12:28
1

Here is one more option using Grid.

data=Round[RandomReal[1,{5,5}],0.01];

colorIt[data_List]:=Module[{style},
    style=Item[Style[#,FontColor->ColorNegate@GrayLevel[#]],Background->GrayLevel[#]]&;
    Map[style,data,{-1}]
]

labelIt[label_List][data_List]:=Join[List/@Prepend[label,Null], Join[{label}, data], 2]

Grid[
     labelIt[{"A","B","C","D","E"}]@colorIt@data
     ,ItemSize->{4,4}
]

enter image description here

Murta
  • 26,275
  • 6
  • 76
  • 166