I draw a plot using ListPlot. But I noticed that PlotMarkers are 'covered' by the axes; see example below:
I was trying to use the option Method -> {"AxesInFront" -> False} but it does not help.
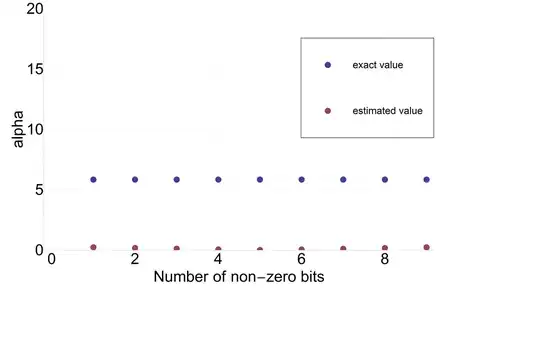
Below is my full code of this plot. The size of markers has to be as set.
ListPlot[{list1, list2},
 PlotStyle -> Directive[AbsolutePointSize[60]],
 GridLines -> Automatic,
 GridLinesStyle -> Directive[Gray, Dashed],
 Frame -> {True, True, False, False},
 FrameLabel -> {"Number of non-zero bits", "alpha"},
 Axes -> False,
 LegendShadow -> None,
 LegendSize -> 0.5,
 PlotLegend -> {Style["exact value", FontFamily -> "Helvetica", 130],
   Style["estimated value", FontFamily -> "Helvetica", 130]},
 LegendPosition -> {0.10, 0.10},
 PlotRange -> {0, 20},
 ImageSize -> 7000,
 Method -> {"AxesInFront" -> False}]
Solution suggested by evanb:
