I've created a plot using the following code:
ListPlot[{top, bottom},
 PlotStyle -> Directive[AbsolutePointSize[100]],
 GridLines -> Automatic,
 GridLinesStyle -> Directive[Gray, Dashed],
 Frame -> {True, True, False, False},
 FrameLabel -> {"Number of non-zero bits", "alpha"},
 Axes -> False,
 LegendShadow -> None,
 PlotLegend -> {Style["exact value ", FontFamily -> "Helvetica", 130],
    Style["estimated value", FontFamily -> "Helvetica", 130]},
 LegendOrientation -> Horizontal,
 LegendSpacing -> 1,
 (*LegendTextSpace->0.5,*)
 (*LegendBorderSpace->0.1,*)
 LegendSize -> {0.95, 0.15}, LegendPosition -> {-0.5, 0.6},
 LegendBorder -> None,
 LegendTextOffset -> {-0.8, 2.4},
 PlotRange -> {0, 20},
 ImageSize -> 7000,
 PlotRangeClipping -> False]
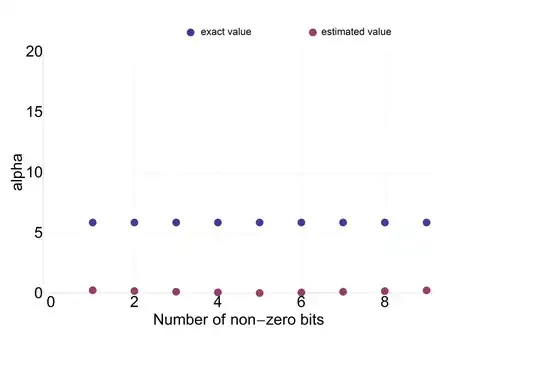
Is there any way to increase the distance between the ticks and axes?
In my opinion, the ticks below the x axis are too close, and I would like to increase the distance between points {0,2,4,6,8} and the x axis.
Can anyone suggest a good way to do this that is compatible with Mathematica 7?
Ticksdoc somewhere – Öskå Nov 11 '14 at 12:27