Ticker[comp_String] :=
Interpreter["Company"][comp] /. Entity[_, x_] :> x
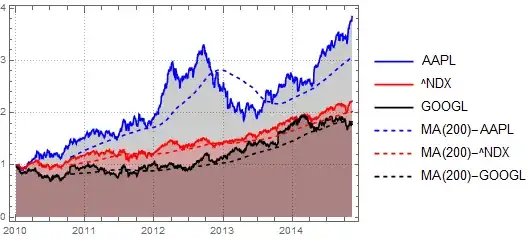
ticks = Ticker /@ {"Apple", "Google"}
{"NASDAQ:AAPL", "NASDAQ:GOOGL"}
DateListPlot[{
  FinancialData[ticks[[1]],  "CumulativeFractionalChange", {2010}],
  FinancialData[ticks[[2]],  "CumulativeFractionalChange", {2010}],
  FinancialData["NASDAQ100", "CumulativeFractionalChange", {2010}]
  },
 GridLines -> Automatic,
 PlotLegends -> {ticks[[1]], ticks[[2]], "NASDAQ100"},
 Joined -> True,
 ImageSize -> 500,
 Filling -> Bottom]

I have many questions, but only pose two:
(1) How can I efficiently apply a moving average of , let's say, 200 days to the above lines?
(2) How can I sort the PlotLegends? (NASDAQ100 should appear before NASDAQ:GOOGL)