Possible Duplicate:
Labelling ArrayPlot Charts
I am making a MatrixPlot. For example, consider the following:
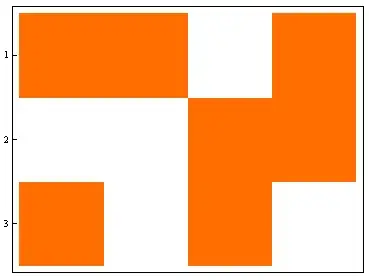
list = {{1, 1, 0, 1}, {0, 0, 1, 1}, {1, 0, 1, 0}};
MatrixPlot[list]
which yields:

But now suppose I want to label the axes with other numbers. For example, I would like to label the ticks on the horizontal axis as 101, 167, 188, 205 (as they are not now), and the ticks on the vertical axis as 1, 2, 3 (as they already are). I know this is a strange request, but it is because I would like to label the horizontal axis according to "particle number" (which is an integer in my application).
Or maybe a better way to phrase the question is, is it possible to label axis/frame ticks with any arbitrary string (for example, labeling the horizontal axis with "Alice", "Bob", "Carla", and "David")? One possibility seems like FrameTicks, but I can't seem to figure out if it can be used to map strings.
If I use
list = {{1, 1, 0, 1}, {0, 0, 1, 1}, {1, 0, 1, 0}};
MatrixPlot[list,
 FrameTicks -> {{{1, 2, 3}, None}, {{101, 167, 188, 205}, None}}]
I get:
because, of course, FrameTicks thinks I'm referring to which discrete values to label.
Also, if I try:
list = {{1, 1, 0, 1}, {0, 0, 1, 1}, {1, 0, 1, 0}};
MatrixPlot[list,
 FrameTicks -> {{{1, 2, 3}, None}, {{"101", "167", "188", "205"},
    None}}]
I get "Not a valid tick specification."
Do you have any other ideas?
