3

I use this command to plot all values from the 1st column of Table "results" against all values from the 2nd column:

ListLinePlot[{results[[All, {1, 2}]]}

Now, I would like to plot all columns two until some N (always against the first column). I tried (for N=3):

ListLinePlot[ArrayFlatten[Table[results[[All, {1, i}]], {i, 2, 3}]]

which does work. Is this the simplest solution? Further, how to display the legend for a general N, if for N=3 the relevant part of ListLinePlot looks like:

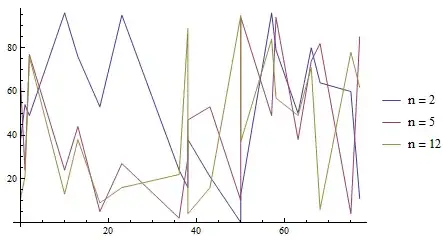
PlotLegends -> Placed[{"n=1", "n=2", "n=3"}, Right]

Thanks!

wondering
  • 595
  • 3
  • 18

1 Answers1

4
results = Sort@RandomInteger[100, {20, 30}];

Columns 2, 5 and 12 versus 1:

ListLinePlot[results[[All, {1, #}]] & /@ {2, 5, 12},
 PlotLegends -> Placed[Row[{"n = ", #}] & /@ {2, 5, 12}, Right]]

enter image description here

columns = {2, 3, 15, 20};
ListLinePlot[results[[All, {1, #}]] & /@ columns,
    PlotLegends -> Placed[Row[{"n = ", #}] & /@ columns, Right]]

enter image description here

Or, you can define a function that takes a list of columns to plot against column 1:

llp[cols_List] := ListLinePlot[results[[All, {1, #}]] & /@ cols, 
                  PlotLegends -> Placed[Row[{"n = ", #}] & /@ cols, Right]]
llp[{2, 3 , 15, 20}]
(* same picture *)
kglr
  • 394,356
  • 18
  • 477
  • 896