This code:
arrowAxes[arrowLength_] :=
  Map[{Apply[RGBColor, #], Arrow[Tube[{{0, 0, 0}, #}]]} &, arrowLength IdentityMatrix[3]];

Graphics3D[
  {Sphere[{1, 1, 1}], arrowAxes[3]},
  Axes -> True,
  Boxed -> False,
  AxesOrigin -> {0, 0, 0},
  AxesStyle -> Opacity[0],
  TicksStyle -> Opacity[1]]
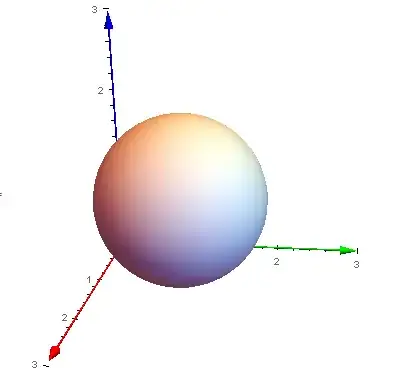
will produce these plots:


How not to display tick and labels that are behind the sphere? (this is the case in the first and second picture above; third picture is correct in that sense, since blue axis is in front of the sphere)
There is a suspicion that this may be a bug, related to AxisOrigin. Therefore, I am adding tag "bugs".

AxesEdgelike in this question Method -> {“AxesInFront” -> False} for Graphics3D. But I'm not sure because you want to hide ticks behind Sphere and then you are saying that the third example is correct... – Kuba Nov 21 '14 at 13:13AxesEdgeare different objects which will always be on top of 3D graphics...AxisOriginor not using it are constructed from different base/origin. – Silvia Nov 22 '14 at 08:40