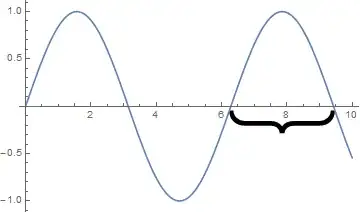
I would like to refer to certain ranges of the x axis with the help of of some appropriately stretched and placed curly braces. I cannot figure out how to place a appropriately rotated and stretched curly brace in a plot.
Asked
Active
Viewed 3,487 times
︷). – Karsten7 Nov 28 '14 at 21:02