7

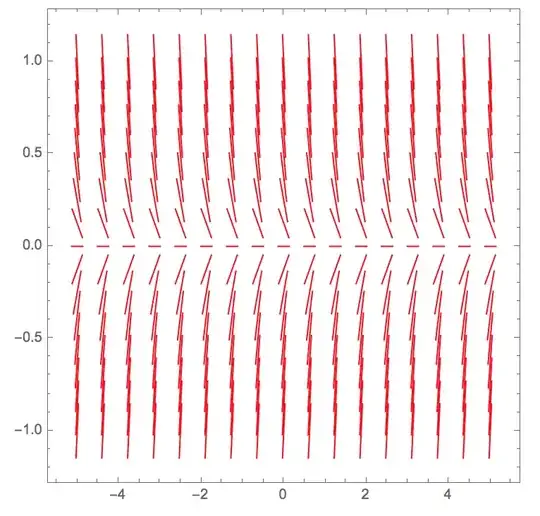
I want a slope field for a scalar differential equation. For simplicity I have chosen $dx/dt=rx$, where $r$ is a parameter. I used VectorPlot for the slope field as you can see from the code below. $|r|$ is bounded by 5. All is good when the PlotRange has the same horizontal and vertical ranges. Observe what happens when $a = 5$ and $b=1$. Unless the value of parameter $r$ is close to zero, the direction lines for a given $x$ value are so long that they spill over to the rows above and below.

Because this is a slope field and not a direction field for a 2D system, the length of the vectors should be constant. How can I achieve that? I have tried various rescaling and normalization but to no avail. Previous posts I've seen do not address this matter.

Thanks.

Manipulate[
 VectorPlot[{1, r x}, {t, -a, a}, {x, -b, b}, VectorPoints -> 17, 
  VectorScale -> {0.03, Automatic, None}, 
  VectorStyle -> {{Red, Arrowheads[0]}}],
 {a, 1, 5},
 {b, 1, 5},
 {r, -5, 5}]
Stephen
  • 1,156
  • 5
  • 12
  • I am familiar with Marc McClure's post. He just addresses the removal of the arrowheads which I have done already. McClure's code uses a PlotRange whose horizontal and vertical ranges are identical. – Stephen Nov 28 '14 at 22:55
  • Not only should the length of the vectors be constant, but there should be a way to define their length – Stephen Nov 28 '14 at 23:01
  • OK, good point. – C. E. Nov 28 '14 at 23:20
  • :-) There should be a way to specify the common length of all the vectors in the VectorPlot – Stephen Nov 28 '14 at 23:42
  • What about varying the first argument of VectorScale? – murray Dec 03 '14 at 21:34
  • Varying VectorScale only scales the vectors by a uniform factor. So direction lines when |x| is near one are too long. – Stephen Dec 03 '14 at 22:05

1 Answers1

4

If you take the problematic plot and normalize the arrows dimensions by brute force, the issue becomes clear!

plot = (* copy-paste Manipulate's graphic *)

Reap[plot /. Arrow[pts : {pt0 : {__}, {__}}] :> 
     Sow[Line[{pt0, pt0 + .2 Normalize@First@Differences@pts}]]];
Graphics@%[[2, 1]]
%%[[1]]

The vectors are correct, but then displayed in the plot they get distorted! It must be the plot's AspectRatio messing with their sizes!

And, indeed, if you add AspectRatio -> Automatic, ImageSize -> 300 to VectorPlot, you get nice, equal vectors!

But if you want the plot to be square, I see no easy way other than re-scaling your functions and maintaining the plot range in the {-1, 1} range. But I'd love to be wrong on that one. In your case:

 Manipulate[VectorPlot[
              Evaluate[{1, r x} /. {x -> b*x, t -> a*t}]
              ,{t, -1, 1}, {x, -1, 1}
              ,VectorPoints -> 17, VectorScale -> {0.03, Automatic, None}, VectorStyle -> {{Red, Arrowheads[0]}}]
  , {a, 1, 5}, {b, 1,  5}, {r, -5, 5}]

Aisamu
  • 2,618
  • 14
  • 17
  • Thanks for taking a stab at this problem, but your solution does not work for me. The slope lines get too crowded (and too long) as |r| is increased. I have been trying to develop a knock-off of John Polking's dfield (and pplane) which is implemented in Matlab and as *.jar files. – Stephen Dec 04 '14 at 13:06
  • That's strange! I've just double-checked it, and the slope line's length is constant for any r, provided you use AspectRatio -> Automatic. V10 here, though. As for the crowding, you have to change VectorPoints to match the range's aspect ratio... But, until someone comes with a proper solution, you can scale the vector field itself and maintain the plot with identical ranges to achieve dfield's appearance! – Aisamu Dec 04 '14 at 17:06
  • Please edit your code to show the manipulated version with controls for a, b, and r, – Stephen Dec 04 '14 at 17:10
  • Your code does what I was looking for. Now I want to display the actual ticks values instead of the "nornalized" ones. Many thanks for your simple solution. – Stephen Dec 05 '14 at 03:12