Is it possible to create such kind of GIF via Mathematica?

Is it possible to create such kind of GIF via Mathematica?
Clear["Global`*"]
f[x_, θ_] =
  RotationTransform[θ, {1, 0, 1}, {5 Pi, 0, 5 Pi}][{x,
     0, -((10 Pi)/6) Sin[x] + 5 Pi}][[{1, 3}]];
p1 = ParametricPlot[{x, x}, {x, -10 Pi, 10 Pi},
   PlotRange -> {{-10 Pi, 10 Pi}, {-10 Pi, 10 Pi}, {-10 Pi, 10 Pi}},
   ImageSize -> 300, Axes -> True];
n = 7;
g[a_] := Evaluate[
   t^(1/n) (5 a π^2)/(1 + 5 a π) + (1 - t^(1/n)) (
       10 a π)/(1 + 5 a π) /.
     t -> Rescale[a, {0.002, 2 Pi}, {0, 1}] // Simplify];
t = Pi;
Manipulate[
 If[var < Pi + 0.0025,
  Show[p1, ParametricPlot[f[x, var], {x, -10 Pi, 10 Pi}]],
  Show[p1, PolarPlot[
     5 Pi + 1/(var - t) -
      5/3 π Sin[(2 Pi)/(2*g[var - t]/10) θ], {θ, -g[
        var - t], g[var - t]},
     PlotRange -> {{-10 Pi, 10 Pi}, {-10 Pi, 10 Pi}},
     ImageSize -> 300] /.
    Line[data___] :>
     Translate[Line[data], {-(1/(var - t)), 0}]]], {var, 0,
  2 Pi + Pi}]

The best way is take suitable discrete points of var artificially, not let var change uniform.
Update 1 A better solution from other people.
Manipulate[
 ParametricPlot[{1 - 1/y +
    Cos[θ] (2 + 1/y - Sin[(10 θ)/y]),
   Sin[θ] (2 + 1/y -
      Sin[(10 θ)/y])}, {θ, -π y, π y},
  PlotRange -> {{-5, 5}, {-5, 5}}], {y, 0.01, 1}]
Here's a start, the 2nd transformation is tricky for me.
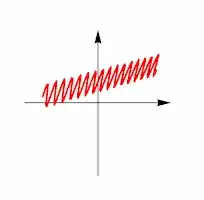
data = Table[{i, 0.1 Sin[100 i] + 0.7, 0}, {i, 0, 1, 0.01}];
gr = Graphics3D[{Thick, Red, Line@data}, Boxed -> False];
Manipulate[Graphics3D[
  {If[t < 0.1 Pi, {Dashed, Blue, Line[{{0, 0, 0}, {1, 1, 0}}]}, {}],
   Arrow[{{0.5, 0, 0}, {0.5, 1, 0}}],
   Arrow[{{0, 0.5, 0}, {1, 0.5, 0}}],
   GeometricTransformation[{Thick, Red, Line@data},
    RotationTransform[t, {1, 1, 0}]]},
  PlotRange -> {{0, 1}, {0, 1}, {-1, 1}}, Boxed -> False,
  SphericalRegion -> True, ViewPoint -> Top], {t, 0, 0.99 Pi}]