2

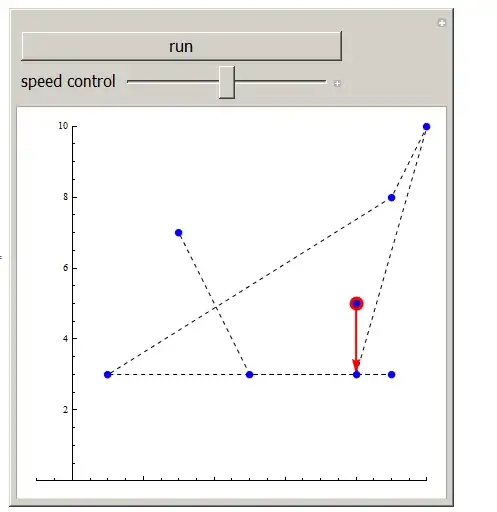
I have a list of ordered pairs, named bob. They represent locations on a graph.

bob = {{8, 5}, {8, 3}, {10, 10}, {9, 8}, {1, 3}, {9, 3}, {5, 3}, {3, 7}}

I then created a line between all of them with this function:

Graphics[Line[bob]]

I want to have a red dot move along the line starting at {8,5} to {8,3} to ... to {3,7}.

Can anybody help?


My second part (which is less important, but wanted) is to do the same thing but not have the line visible. Like.. Have the red dot go from {8,5} to {8,3} and along the way, leave a trail behind.

If either (or both!) are possible, that would be incredible!

Thank You!

Travis
  • 21
  • 1

1 Answers1

4

enter image description here

Manipulate[
 tick;
 If[n < (m - 1), n++; tick = Not[tick]];
 Pause[pause];
 Show[
  Graphics[{
    {Red, Disk[bob[[n]], .2]}, line,
    {Red, Thick, Arrow[{bob[[n]], bob[[n + 1]]}]},
    }, Axes -> True, ImagePadding -> 5, ImageSize -> 400, 
       PlotRange -> {{-1, 10}, {0, 10}}],
  bobl
  ],

 Button["run", n = 0; tick = Not[tick]],
 {{pause, 1, "speed control"}, 0, 2, .1},
 {{tick, False}, None},
 {{n, 0}, None},
 TrackedSymbols :> {tick},

 Initialization :>
  (
   bob = {{8, 5}, {8, 3}, {10, 10}, {9, 8}, {1, 3}, {9, 3}, {5, 3}, {3, 7}};
   m = Length[bob];
   line = {Dashed, Line[bob]};
   bobl = ListPlot[bob, PlotStyle -> Blue]
   )
 ]
Nasser
  • 143,286
  • 11
  • 154
  • 359