I'm trying to draw two graphics object well defined and an arrow in between pointing left to right (symbolizing the mapping between the two). I've tried drawing the arrow first in a graphics object and then using GraphicsRow but the end result is unsatisfying: I get that the arrow takes a third of the space, when I would like it much smaller. How could I get there?
Asked
Active
Viewed 572 times
5
Learning is a mess
- 501
- 1
- 3
- 9
-
Select the graphics, Right-click, "Drawing Tools" – Dr. belisarius Dec 05 '14 at 14:58
-
@belisarius: I did it this way in the past, but I would be interested in a systematic way of doing it. – Learning is a mess Dec 05 '14 at 15:06
-
Then check out this. It's a nice mix of both, I believe – Dr. belisarius Dec 05 '14 at 15:24
3 Answers
3
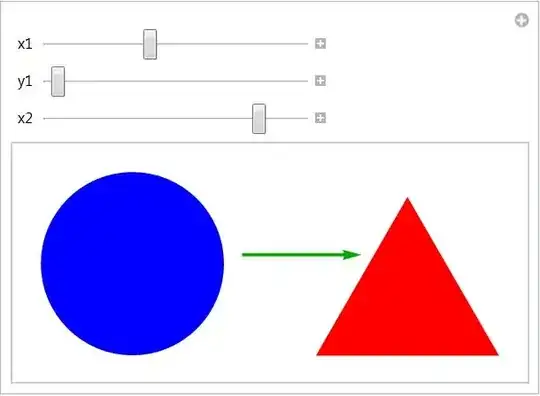
Try this:
 Manipulate[Show[{
   Graphics[{Blue, Disk[{0, 0}, 1]}],
   Graphics[{Red, Polygon[{{4, -1}, {3, Sqrt[3] - 1}, {2, -1}}]}],
   Graphics[{Darker@Green, Thickness[0.007],
     Arrow[{{x1, y1}, {x2, y1}}]}]

   }], {{x1, 1}, 0, 3}, {{y1, 0.1}, 0, 3}, {{x2, 2.5}, 0, 3}]
and play with the sliders. You should see the following:
Have fun!
Alexei Boulbitch
- 39,397
- 2
- 47
- 96
3
gF = Graphics[{#[[1]], #[[2]], Black,
     Text[Style["\[RightArrow]", 72, Bold], Scaled@{.5, 1/2}],
     #2[[1]], Translate[#2[[2]], {3., 0}]}, ImageSize -> 500] &;

gF[{Blue, Disk[]}, {Red, Polygon[{{1, -1}, {0, Sqrt[3] - 1}, {-1, -1}}]}]

gF[{Blue, Polygon[Table[{Cos[2 \[Pi] k/6], Sin[2 \[Pi] k/6]}, {k, 0,  5}]]},
   {Red,  Polygon[Table[{Cos[2 \[Pi] k/9], Sin[2 \[Pi] k/9]}, {k, 0, 8}]]}]

Or
g1 = Graphics[{Blue, Disk[{0, 0}, 1]}, BaselinePosition -> Center, ImageSize -> 300];
g2 = Graphics[{Red, Polygon[{{4, -1}, {3, Sqrt[3] - 1}, {2, -1}}]},
   BaselinePosition -> Center, ImageSize -> 300];
g3 = Graphics[{Orange, Polygon[Table[{Cos[2 \[Pi] k/9], Sin[2 \[Pi] k/9]}, {k, 0, 8}]]},
   BaselinePosition -> Center, ImageSize -> 300];
g4 = Graphics[Text@Style["\[RightArrow]", 64, Bold], BaselinePosition -> Center, ImageSize -> 50];

Row[{g1, g2, g3}, g4]

kglr
- 394,356
- 18
- 477
- 896
1
In practice, the output form of Rule is effective for combinations of graphics and other expressions. For example, see:
My answer to Temporal database reconstruction (note existing rules in
AssociationandDataset)Try kguler's graphics with
g1 -> g2 -> g3Can be used to quikly make legends for figures from
Associations. Givendata = <| "a" -> Red, "b" -> Blue|>,data // Normal // Column // Panelgives:

Limitations include:
The result is not a
Graphicsobject (though often it renders to PDF just fine).No control over the arrow's style (or is there?)
alancalvitti
- 15,143
- 3
- 27
- 92