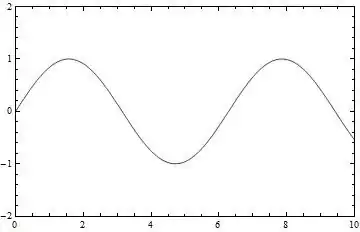
If you want to keep the tick marks, then how about this:
Plot[Sin[x], {x, 0, 6 Pi}, Frame -> True, Axes -> False,
 PlotRange -> {{0, 10}, {-2, 2}}, LabelStyle -> Opacity[0]]

Here I used LabelStyle to make the labels transparent (even though they are still generated together with the ticks). Alternatively, you can manually specify the tick marks with empty labels, but I assume you want something that retains the automatic placement of the ticks.
Another approach:
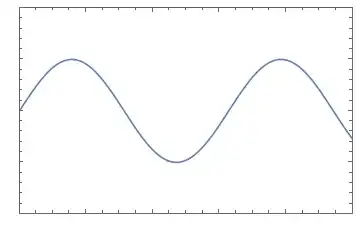
There's also this method, using the ImagePadding option:
Plot[Sin[x], {x, 0, 6 Pi}, Frame -> True, Axes -> False,
 PlotRange -> {{0, 10}, {-2, 2}}, ImagePadding -> 1]
What this does is to make the border around the frame defined by the PlotRange so thin that there isn't enough room to display any of the tick labels. I just have to make sure that there is enough padding to show the frame, that's why the value 0 doesn't work.