Is there a way to automatically choose the y-axes when combining plots (and in passing, why isn't that the default behaviour for Show[ plot1, plot2 ]?)
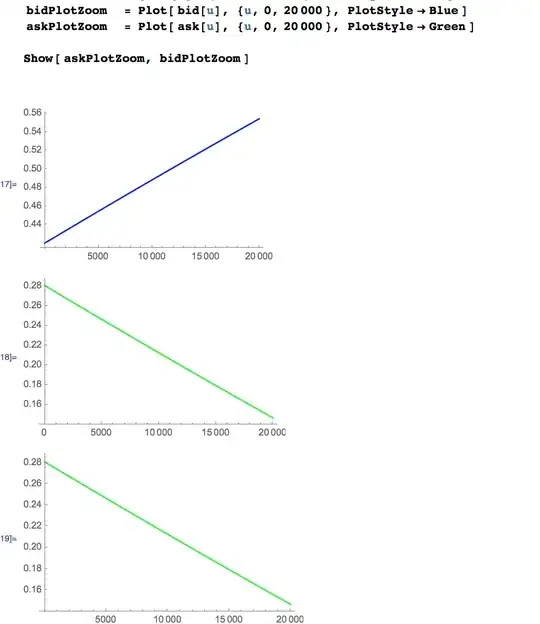
 bidPlotZoom    = Plot[ bid[u], {u, 0, 20000 }, PlotStyle -> Blue ]
 askPlotZoom    = Plot[ ask[u], {u, 0, 20000 }, PlotStyle -> Green ]

 Show[ askPlotZoom, bidPlotZoom ]
Actually I'd settle for a manual way right now :)
Show. Show takes options from the first graphic. – Kuba Dec 09 '14 at 05:09