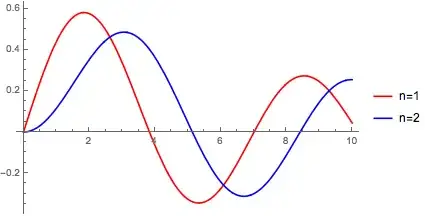
Consider this example:
Plot[Table[BesselJ[n, x], {n, 2}], {x, 0, 10},
 PlotLegends -> {"n=1", "n=2"}, Evaluated -> True]
The results in MMA v9 & V10 are:
V9:

V10:
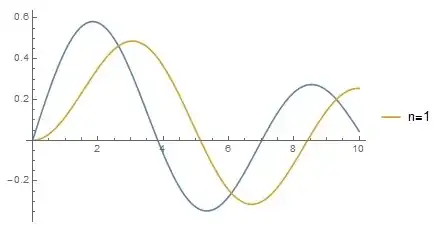
Any idea why V10 can't pick up all PlotLegends? Thanks.
Consider this example:
Plot[Table[BesselJ[n, x], {n, 2}], {x, 0, 10},
PlotLegends -> {"n=1", "n=2"}, Evaluated -> True]
The results in MMA v9 & V10 are:
V9:
V10:
Any idea why V10 can't pick up all PlotLegends? Thanks.
I am in the middle of the long process of Tracing this issue. I don't yet have a patch but I can point to a part of the code that affects this. The function is:
Legending`LegendDump`plotLegendParser
Within its long definition we have a piece:
Legending`LegendDump`length = Switch[Legending`LegendDump`tag,
  0, Legending`LegendDump`optDimensions,
  _Integer, Legending`LegendDump`optDimensions[[Legending`LegendDump`tag]],
  "Generic",
  If[Legending`LegendDump`arglength === Null, Switch[Legending`LegendDump`argexp,
    Null, 0,
    _List, Length[Legending`LegendDump`argexp],
    _, 1], Legending`LegendDump`arglength]]
This is where the number of functions is determined for the sake of legend generation. The critical part here is:
Length[Legending`LegendDump`argexp]
Which in the case of the example in the question expands to:
Length[{HoldForm[Table[BesselJ[n, x], {n, 2}]]}]
The plot function is being passed unevaluated (held by HoldForm) to Legending`LegendDump`plotLegendParser, which is exactly the sort of problem I expected. I have confirmed that replacing Length[. . .] in this definition with 2 causes the legend to be draw properly for this example, but I have not yet figured out how to determine that value automatically.
This answer is a work in progress but I wanted to get this down before I forget it. It may also serve as a starting point for anyone else who wishes to tackle the problem.
Not really an idea or insight, but a workaround (on 10.0 for Mac OS X x86 (64-bit) (September 10, 2014);
Plot[Table[BesselJ[n, x], {n, 2}], {x, 0, 10},
 PlotStyle -> {Red, Blue},
 PlotLegends -> LineLegend[{Red, Blue}, {"n=1", "n=2"}],
 Evaluated -> True]
The "Help" is not really a help:


except the workaround I can not offer an explanation for this behavior.
Evaluatedoes work:Plot[Evaluate@Table[BesselJ[n, x], {n, 2}], {x, 0, 10}, PlotLegends -> {"n=1", "n=2"}], which is also a workaround. – Jacob Akkerboom Dec 15 '14 at 19:38