12

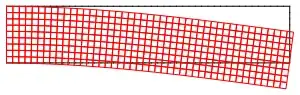
I am trying to represent 2D deformations on a rectangular grid. In Mathematica 10, there is a method to solve the elastic differential equations and then represent the deformation as presented here:

https://www.wolfram.com/mathematica/new-in-10/pdes-and-finite-elements/compute-a-plane-strain-deformation.html

Now I only want to visualize a deformation I actually have an analytic functional form for, i.e. I do have the functions u[x_,y_] and v[x_,y_] which represent the deformation in the x and y directions, however I cannot get it working. I thought that the PDE solver NDSolveValue returns some InterpolatingFunction so I tried to use an InterpolatingFunction type of object for u and v (which, I know it sounds stupid), but even doing so, the u["ElementMesh"] returns None so I'm completely stuck in here. Any help would be appreciated!

Bonus question: is it possible to color the mesh according to the deformation (by defining some color scale, for instance)?

A deformation field visualized with the finite element package

J. M.'s missing motivation
  • 124,525
  • 11
  • 401
  • 574
botond
  • 165
  • 7

1 Answers1

17

You have to create your own mesh and you have to convert your u and v to mesh interpolations. (In the example in the documentation, NDSolveValue does this itself in constructing uif, vif.)

Example:

Needs["NDSolve`FEM`"]

mesh = ToElementMesh[FullRegion[2], {{0, 5}, {0, 1}}];

u = Function[{x, y}, x (y - 0.5)/25];
v = Function[{x, y}, -x^2/50];

uif = ElementMeshInterpolation[{mesh}, u @@@ mesh["Coordinates"]];
vif = ElementMeshInterpolation[{mesh}, v @@@ mesh["Coordinates"]];

ElementMeshDeformation[mesh, {uif, vif}][
 "Wireframe"["ElementMeshDirective" -> Directive[EdgeForm[Red], FaceForm[]]]]

Mathematica graphics

Update 1 - Thanks to user21 for the help with how to use ElementMeshToGraphicsComplex to process the deformed mesh.

Coloring by the norm of {u, v}, via post-processing:

nm = ElementMeshDeformation[mesh, {uif, vif}];

Show[
 Graphics[
  ElementMeshToGraphicsComplex[nm, All, 
   VertexColors -> (ColorData["Rainbow"] /@ 
      Rescale[Norm[{u @@ #, v @@ #}] & /@ mesh["Coordinates"]])]],
 nm["Wireframe"]
 ]

Mathematica graphics

(The graphics consists of a single Polygon object inside a GraphicsComplex. This is the easiest way to get a coloring that depends on position coordinates.)

Update 2 - Various approaches to coloring.

For a function of the coordinates, use the following form for VertexColors:

colorscalar[x_, y_] := Norm[{u[x, y], v[x, y]}];
VertexColors -> (ColorData["Rainbow"] /@ Rescale[colorscalar @@@ mesh["Coordinates"]])

For a function of a point, use the following form for VertexColors:

colorscalar[{x_, y_}] := Norm[{u[x, y], v[x, y]}];
VertexColors -> (ColorData["Rainbow"] /@ Rescale[colorscalar /@ mesh["Coordinates"]])
Michael E2
  • 235,386
  • 17
  • 334
  • 747
  • Awesome, it works like a charm, this is exactly what I needed! Thank you very much! – botond Dec 16 '14 at 13:00
  • Any comments on the coloring?... – botond Dec 16 '14 at 13:01
  • Yes, basically the question is how to color the deformed mesh according to the deformation (larger deformations with warmer colors, smaller ones with colder colors, for example). I haven't used Directive so far, so I'm not even sure that this is possible. I'd like to do something like this: http://www.comsol.com/support/knowledgebase/1003/files/3123/kb_1003_plot_mesh_with_sol.png on the deformed mesh (and in 2D, of course). Thanks! – botond Dec 16 '14 at 13:23
  • Thanks, that looks nice! Is there a way to keep the mesh as well?... Shall I combine the Directive of the meshgrid and the colored image? – botond Dec 16 '14 at 13:45
  • 3
    nm = ElementMeshDeformation[mesh, {uif, vif}] will give you a new mesh. You could then use Graphics[ElementMeshToGraphicsComplex[nm, All, VertexColors -> (ColorData["Rainbow"] /@ Rescale[Norm[{u @@ #, v @@ #}] & /@ nm["Coordinates"]])]] to make the conversion. – user21 Dec 16 '14 at 14:04
  • Excellent! Thank you very much! – botond Dec 16 '14 at 14:20
  • 1
    @Botond You're welcome. I'm thinking that the coordinates used for the coloring ought to be the original ones mesh["Coordinates"] instead of the deformed ones nm["Coordinates"]. It makes an imperceptible difference, but doesn't using mesh seem the correct way to you? – Michael E2 Dec 16 '14 at 14:25
  • @MichaelE2, that is correct. mesh is the initial reference frame, and this becomes very important, especially when the displacement field is not homogeneous. Also, one last thing: it would be nice to actually color according to the strain rather than the displacement, i.e. specifying a scalar function ep[x_,y_] which is used only for the coloring. I guess that could be done somehow by substituting Norm[{u @@ #, v @@ #}] by ep, but I'm still struggeling with understanding the syntax... – botond Dec 16 '14 at 14:37
  • @MichaelE2, yes, of course it should be the non deformed mesh["Coordinates"]. – user21 Dec 16 '14 at 15:35
  • @MichaelE2, I'm not sure about the difference between "function of the coordinates" and "function of a point", however the first one (function of the coordinates) works for me just as I expected! – botond Dec 16 '14 at 15:51
  • 1
    @MichaelE2, I added some documentation of ElementMeshToGraphoicsComplex and a variation of this example. It's going to be available in a future version. Thanks! – user21 Dec 16 '14 at 15:55
  • @Botond The function of a point basically has a single argument of the from an ordered pair {x, y}; the function of the coordinates is a function of two arguments, each a number, x and y. Look closely at the form of the definition of colorscalar in the two examples. The first matches the ep in your comment; the second is basically like the function in my example. That's why I showed both. The curious can also ponder why Apply (@@@) and Map (/@) are the appropriate operations for each respective case. – Michael E2 Dec 16 '14 at 16:01
  • @MichaelE2, thanks a lot, I see it now. Also, thanks for all your help guys, I've been struggling with this for days! – botond Dec 16 '14 at 16:11
  • @user21 You're welcome and thanks, too! I appreciate the work you've put into the documentation. It's very helpful. – Michael E2 Dec 16 '14 at 16:22
  • I managed to make some really nice plots with this method. One thing I couldn't get working is to add a simple colorbar to the right of the plot corresponding to the color scale of the plot. The standard PlotLegend doesn't seem to work... Any idea? Thanks! – botond Dec 31 '14 at 15:13
  • Perhaps Legended and BarLegend will do it. I'm in a field where legending is unimportant, unlike many others, judging by the many questions on this site about issues with legends. You might search the site, if my suggestion doesn't work. – Michael E2 Dec 31 '14 at 16:41