3
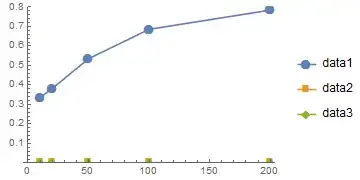
data1 = {{10, 0.336326}, {20, 0.382843}, {50, 0.53543}, {100, 0.686378}, {200, 0.784768}};
data2 = {{10, 0.000174682}, {20, 0.000143662}, {50, 0.000102721}, {100, 0.000151156}, {200, 0.000159283}};
data3= {{10, 0.00005875}, {20, 0.000055}, {50, 0.000055}, {100, 0.00010375}, {200, 0.000125}};

I am now using ListPlot,

ListPlot[{data1, data2, data3}, 
 Joined -> True, PlotMarkers -> {Automatic, 15}, 
 PlotRange -> {0.000001, 0.8}, 
 PlotLegends -> Placed[ LineLegend[{"data1", "data2", "data3"}], {After, Right}] ]

I get the following figure. However, data2 and data3 are too small to see. How should I deal with this situation? Particularly, how to adjust the y-ticks to show all the data in a more readable way? Is it possible to use non-uniform y-ticks in ListPlot?

list-plot

hengxin
  • 840
  • 6
  • 10

1 Answers1

3

If you must use ListPlot, then perhaps you should make two or three separate plots and align them one atop the other. A better way is to use ListLogPlot, however:

ListLogPlot[{data1, data2, data3}, Joined -> True, 
     PlotMarkers -> {Automatic, 15}, PlotRange -> {0.000001, 0.8}, 
     PlotLegends -> 
      Placed[LineLegend[{"data1", "data2", "data3"}], {After, Right}]]
David G. Stork
  • 41,180
  • 3
  • 34
  • 96
  • @Sektor Is it possible to use non-uniform y-ticks in ListPlot? – hengxin Dec 17 '14 at 11:37
  • 1
    I realized that it is still the original data that is plotted in the ListLogPlot. So ListLogPlot is OK here. However, if my data contains zeros, how to show them in ListLogPlot (Log[0] is not defined)? – hengxin Dec 18 '14 at 05:36