5

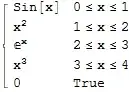
I have a list of N functions called functionList. N can be any number. Also, I have a list called nodes whose elements are in the interval i want to plot in.

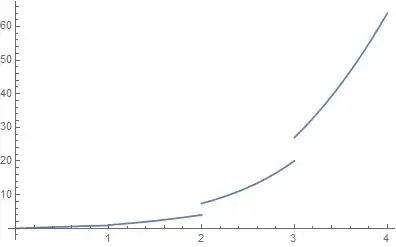
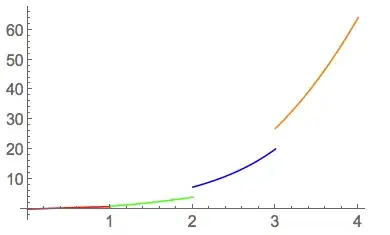
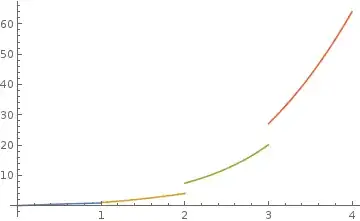
My aim is to visualise in one graphic all the functions functionList[[1]], functionList[[2]], ..., functionList[[n]] in the respective subinterval.

This means to iterate over functionList and plot functionList[[i]] in the interval from nodes[[i]] to nodes[[i+1]].

First, functionList[[1]] in the interval from nodes[[1]] to nodes[[2]]. Then, functionList[[2]] in the interval from nodes[[2]] to nodes[[3]].

I know about about
Plot[Piecewise[{{x^2, x < 0}, {x, x > 0}}], {x, -2, 2}]
but how can I combine with iterating over my functionList?

I am looking for something like this

Plot[Piecewise[{{functionList[[i]], x > nodes[[i]]&&x<nodes[[i+1]]}, {i,1,N}], {x, 0, 2}]
Sjoerd C. de Vries
  • 65,815
  • 14
  • 188
  • 323
dTod
  • 53
  • 3
  • 1
    how about funs = {x, x^2}``conds = {{x < 1}, {x >= 1}}`` f[x_] = Piecewise@Transpose[{funs, conds}] /. List[a_] -> a – chris Dec 27 '14 at 15:14
  • 1
    or Piecewise@MapThread[{#1, Sequence @@ #2} &, {funs, conds}] – chris Dec 27 '14 at 15:17
  • Welcome to Mathematica.SE! I suggest the following:
    1. As you receive help, try to give it too, by answering questions in your area of expertise.
    2. Read the [faq]!
    3. When you see good questions and answers, vote them up by clicking the gray triangles, because the credibility of the system is based on the reputation gained by users sharing their knowledge.

    Also, please remember to accept the answer, if any, that solves your problem, by clicking the checkmark sign!

    –  Dec 27 '14 at 15:17

4 Answers4

4
functionList = {Sin[x], x^2, Exp[x], x^3};
nodes = {0, 1, 2, 3, 4};

f[x_] = Piecewise[Transpose[{functionList, #1 <= x <= #2 & @@@ Partition[nodes, 2, 1]}]]

Mathematica graphics

Plot[f[x], {x, 0, 4}]

Mathematica graphics

Sjoerd C. de Vries
  • 65,815
  • 14
  • 188
  • 323
  • What's the easiest way, in the context of this solution, to have Mathematica automatically color the various pieces different colors -- much as would happen with a simple Plot[{f1x, f2x, ..., fnx}, {x, a, b}] expression -- without providing an explicit list of colors in a PlotStyle option? – murray Dec 27 '14 at 16:12
  • @murray I don't think there's a really easy solution to that. You could split the Piecewise in several different ones or so, but I wouldn't call that easy. BTW Your approach (a list of colors in PlotStyle) wouldn't work as there's only one function (the Piecewise one) to work with. – Sjoerd C. de Vries Dec 27 '14 at 16:19
  • @murray The closest I may get would be something like f[x_] := functionList (Piecewise[{{1, #1 <= x <= #2}, {I, True}}] & @@@ Partition[nodes, 2, 1]) and then Plot[f[x] // Evaluate, {x, 0, 4}]. Evaluate is necessary for plot to realize there is more than one function involved. – Sjoerd C. de Vries Dec 27 '14 at 16:34
  • I should have searched before asking; this was already asked and answered at http://mathematica.stackexchange.com/questions/1128/plotting-piecewise-function-with-distinct-colors-in-each-section. – murray Dec 27 '14 at 22:13
4

Here's a way that allows you to specify the colors of each interval.

colors={Red, Blue, Green, Orange};

Show[Thread[
   p[functionList, Partition[nodes, 2, 1] /. {a_, b_} :> {x, a, b}, 
    Thread[PlotStyle -> colors]]] /. p -> Plot, 
 PlotRange -> Automatic]

pic


DavidC
  • 16,724
  • 1
  • 42
  • 94
4

Using Sjoerd's example:

functionList = {Sin[x], x^2, Exp[x], x^3};
nodes = {0, 1, 2, 3, 4};

Plot[Evaluate@MapThread[ConditionalExpression,  
                       {functionList,Thread[Most @ nodes < x <= Rest @ nodes]}],{x,0,4}]

or

Plot[Evaluate@Thread[ConditionalExpression@@ 
                       {functionList,Thread[Most @ nodes < x <= Rest @ nodes]}],{x,0,4}]

or

Plot[Evaluate@MapThread[Piecewise[{{##}},Indeterminate]&,
                {functionList,Thread[Most @ nodes < x <= Rest @ nodes]}],{x,0,4}]

enter image description here

kglr
  • 394,356
  • 18
  • 477
  • 896
1
Plot[f[x], {x, -1, 4}, 
 ColorFunction -> Function[{x}, 
   Which[x < nodes[[1]], Red, nodes[[1]] < x < nodes[[2]], Green,
    nodes[[2]] < x < nodes[[3]], Orange, nodes[[3]] < x < nodes[[4]], 
    Yellow, nodes[[4]] < x, Purple]],
 ColorFunctionScaling -> False]

enter image description here

Or... more generally:

PrependTo[nodes, -\[Infinity]];
AppendTo[nodes, \[Infinity]];

myColorList = Table[Hue[i/Length[nodes]], {i, Length[nodes]}];

Plot[f[x], {x, -1, 4}, 
  ColorFunction -> 
   Function[{x}, 
    Which @@ 
     Flatten@Table[{nodes[[i]] < x < nodes[[i + 1]], 
        myColorList[[i]]}, {i, Length[nodes] - 1}]
    ],
  ColorFunctionScaling -> False]
David G. Stork
  • 41,180
  • 3
  • 34
  • 96