28

How do I control the shape of my arrow heads? LaTeX's TikZ package has a wide variety of predefined arrowhead styles, some of which I'd like to try to match for Mathematica figures I'm importing into a LaTeX document:

LaTeX arrow examples

But Mathematica's default arrowhead style comes nowhere near any of these. For example,

Graphics[{Thick, Arrow[{{0, 0}, {-50, 0}}]}] 

yields

Default Mathematica arrow

Earlier versions of Mathematica had options for controlling arrowhead shape, but those seem to be gone in 8.0.

How can I get the shape of my Mathematica arrowheads to match the LaTeX TikZ arrowhead styles?

orome
  • 12,819
  • 3
  • 52
  • 100
  • In addition, Mathematica's arrows are scaled differently from LaTeX arrowheads, using a logic I can't discern. Ideally I'd like to also ensure that my Mathematica arrows scale the same way LaTeX arrows do; but that is perhaps a separate question. – orome Jun 19 '12 at 17:39
  • Have you looked at the documentation of Arrowheads? – Heike Jun 19 '12 at 17:42
  • Yes, naturally. Nothing there got me close. – orome Jun 19 '12 at 17:43
  • The Arrow documentation says clearly: The form, orientation, and position of arrowheads can be specified by an Arrowheads directive.  – Sjoerd C. de Vries Jun 19 '12 at 17:43
  • 2
    @Heike: that only gives one example for a custom arrowhead, but nothing about predefined types (though StreamPlot has a miriad of different built-in arrow styles). – István Zachar Jun 19 '12 at 17:44
  • @IstvánZachar: StreamPlot might be a place to start. Are the built-in styles illustrated somewhere? – orome Jun 19 '12 at 17:51
  • Under Options > StreamStyle. But these arrow styles are not implemented generally. Checking the InputForm of this StreamPlot[{-1 - x^2 + y, 1 + x - y^2}, {x, -3, 3}, {y, -3, 3}, StreamPoints -> 1, StreamScale -> {Full, All, 0.05}, StreamStyle -> "CircleArrow"] shows that the extra features are represented as Circle[...] objects instead of preserving a string argument inside Arrowheads. – István Zachar Jun 19 '12 at 17:56
  • @SjoerdC.deVries: Indeed; the question is how? The example just shows specification of position. The only other examples I can find rely on the creation of a graphic that defines the arrowhead, which begs the question: how does one define that to match a desired style? – orome Jun 19 '12 at 17:57
  • @IstvánZachar: So I can't use them outside of StreamPlot? – orome Jun 19 '12 at 17:58
  • 2
    See this question -- it will show how to define custom shapes, and set absolute arrowhead sizes. – Mr.Wizard Jun 19 '12 at 17:58
  • What's wrong with defining your own arrowhead? Most of the examples above won't take more than a few minutes to define. – Sjoerd C. de Vries Jun 19 '12 at 18:19
  • @SjoerdC.deVries: I'd appreciate help with that. It's taking me a lot longer than a few minutes to match the LaTeX styles above (and I get weird results: gaps between the tip of the arrow and the end of the edge, for example). Having a reference for generating matches to these commonly used styles would be pretty widely useful. – orome Jun 19 '12 at 18:46

2 Answers2

29

Here is a Manipulate to design yourself an Arrow:

DynamicModule[{top, baseMid, rightBase, outerMidRight, innerMidRight},
 Manipulate[
  top = {0, 0};
  baseMid = {1, 0} baseMid;
  rightBase = {1, -1} leftBase;
  outerMidRight = {1, -1} outerMidLeft;
  innerMidRight = {1, -1} innerMidLeft;
  h = Graphics[
    {
     Opacity[0.5],
     FilledCurve[
      {
       BSplineCurve[{baseMid, innerMidLeft, leftBase}],
       BSplineCurve[{leftBase, outerMidLeft, top}],
       BSplineCurve[{top, outerMidRight, rightBase}],
       BSplineCurve[{rightBase, innerMidRight, baseMid}]
       }
      ]
     }
    ],
  {{baseMid, {-2, 0}}, Locator},
  {{innerMidLeft, {-2, 0.5}}, Locator},
  {{leftBase, {-2, 1}}, Locator},
  {{outerMidLeft, {-1, 1}}, Locator}
  ]
 ]

Mathematica graphics

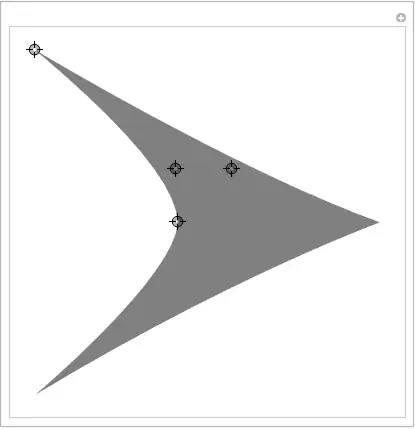
It is easy to add more control points if the need arises.

The arrowhead graphics is put in the variable h. Note that it contains an Opacity function for better visibility of the control points. You need to remove that if you want to have a fully saturated arrow head.

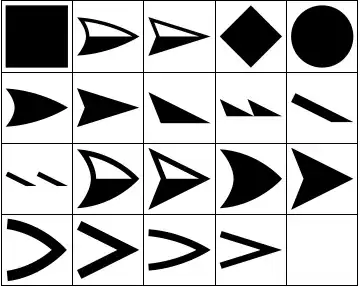
Some examples generated with this Manipulate using:

Graphics[
  { Arrowheads[{{Automatic, 1, h /. Opacity[_] :> Sequence[]}}],
    Arrow /@ 
        Table[{{0, 0}, {Sin[t], Cos[t]}}, {t, 0, 2 \[Pi] - 2 \[Pi]/20, 2 \[Pi]/20}]
  }, 
     PlotRangePadding -> 0.2
 ]

Mathematica graphics

The code for the arrow heads can be found in h. Just copy the graphics or the FullForm to store it for later use.

h /. Opacity[_] :> Sequence[] // FullForm

(* ==>
Graphics[{FilledCurve[{BSplineCurve[{{-0.496, 0.}, {-1., 0.48}, {-2,1}}],            
    BSplineCurve[{{-2, 1}, {-0.548, 0.44999999999999996}, {0, 0}}], 
    BSplineCurve[{{0, 0}, {-0.548, -0.44999999999999996}, {-2, -1}}], 
          BSplineCurve[{{-2, -1}, {-1., -0.48}, {-0.496, 0.}}]}]}
]
*)

EDIT
One more control point will cover most common shapes:

DynamicModule[{top, baseMid, outerMidRight, innerMidRight, 
  innerBaseRight, outerBaseRight},
 Manipulate[
  top = {0, 0};
  baseMid = {1, 0} baseMid;
  innerBaseRight = {1, -1} innerBaseLeft;
  outerBaseRight = {1, -1} outerBaseLeft;
  outerMidRight = {1, -1} outerMidLeft;
  innerMidRight = {1, -1} innerMidLeft;
  h = Graphics[
    {
     Opacity[0.5],
     FilledCurve[
      {
       BSplineCurve[{baseMid, innerMidLeft, innerBaseLeft}],
       Line[{innerBaseLeft, outerBaseLeft}],
       BSplineCurve[{outerBaseLeft, outerMidLeft, top}],
       BSplineCurve[{top, outerMidRight, outerBaseRight}],
       Line[{outerBaseRight, innerBaseRight}],
       BSplineCurve[{innerBaseRight, innerMidRight, baseMid}]
       }
      ]
     }
    ],
  {{baseMid, {-2, 0}}, Locator},
  {{innerMidLeft, {-2, 0.5}}, Locator},
  {{innerBaseLeft, {-2, 1}}, Locator},
  {{outerBaseLeft, {-2, 1.1}}, Locator},
  {{outerMidLeft, {-1, 1}}, Locator}
  ]
 ]

Mathematica graphics

Mathematica graphics

Sjoerd C. de Vries
  • 65,815
  • 14
  • 188
  • 323
24

One source of arrowhead shapes is Graph which comes with a list of predefined arrowhead shapes that you can set using the option EdgeShapeFunction. You can get the names of these shapes by doing something like

arrowheadNames = GraphElementData["Edge"];

Unfortunately, these names by themselves are useless in Arrowheads. Luckily there is a way to extract the Graphics specifications of these arrowheads by converting a Graph to Graphics using Show and extracting the Arrowheads directives:

headlist = 
  Flatten[Cases[
      Show[Graph[{1 <-> 2}, EdgeShapeFunction -> #]], 
      Arrowheads[a_] :> 
       Cases[a, b_GraphicsBox :> ToExpression[b], Infinity, 1], 
      Infinity, 1] & /@ arrowheadNames];

GraphicsGrid[Partition[headlist, 5, 5, {1, 1}, ""], Frame -> All]

Mathematica graphics

You can use these in Arrowheads as follows:

grlist = Graphics[{Arrowheads[{{.3, 1, #}}], Arrow[{{0, 0}, {1, 1}}]}] & /@ headlist;

GraphicsGrid[Partition[grlist, 5, 5, {1, 1}, ""], Frame -> All]

Mathematica graphics

J. M.'s missing motivation
  • 124,525
  • 11
  • 401
  • 574
Heike
  • 35,858
  • 3
  • 108
  • 157
  • 1
    I can't get this code to work anymore. – orome Apr 16 '15 at 18:06
  • Same here, on Mathematica 10.1, this code does not work anymore. – jibe Jul 15 '15 at 12:32
  • 3
    For this to work in Mathematica 10, replace the GraphicsBox with Graphics: headlist = Flatten[Cases[ Show[Graph[{1 \[DirectedEdge] 2}, EdgeShapeFunction -> #]], Arrowheads[a_] :> Cases[a, _Graphics, Infinity, 1], Infinity, 1] & /@ arrowheadNames]; – Gerli Jul 23 '15 at 09:52
  • There is a mistyping, Headlist is written at the beginning with a small l “Headlist” at the end with a capital L “HeadList”... –  Jul 02 '16 at 12:22
  • I've fixed it, @Phil. – J. M.'s missing motivation Jul 02 '16 at 12:29