10

I am working with a function in Mathematica and I am getting some inconsistencies when I plot it. As I really need to understand were this comes from I would appreciate any help.

I am working with a function of the following form:

f2b[b_] = Exp[-1000 - 2 Sqrt[1000*b] - b]*(Erfi[Sqrt[1000]] - Erfi[Sqrt[1000] + Sqrt[b]])

From my understanding this function should go to zero for very small b because both parts, the Exp function as well as the difference between the imaginary error functions, should vanish.

Mathematica calculates:

f2b[E^-30] // N = -3.4517046881*10^-7 as expected.

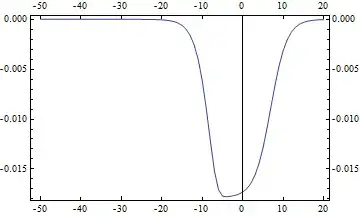
BUT if I plot this function:

Plot[{f2b[E^b], 0}, {b, -50, 0}, PlotStyle -> {{Blue, Thick}, {Red, Thick}}]

Mathematica graphics

Mathematica shows me a plot which is approaching a value of about -0.0175 for small b and has therefore an absolute value much larger the the value at E^-30 calculated above.

If I tabulate, interpolate and plot the function:

t = Table[{b, f2b[E^b] // N}, {b, -50, 0}]; f = Interpolation[t]; Plot[{f[b], 0}, {b, -50, 0}, PlotStyle -> {{Blue, Thick}, {Red, Thick}}]

Mathematica graphics

The plot is looking much different and is approaching zero as expected.

I am wondering whether this has to do something with overflow problems in graphics but I am not sure.

Alexey Popkov
  • 61,809
  • 7
  • 149
  • 368
silky
  • 103
  • 3

3 Answers3

7

Your function isn't evaluating correctly when given inexact input:

In[16]:= Table[f2b[N[E^-k]], {k, 0, 50, 10}]

Out[16]= {-0.01730248257001, -0.01784636881283, -0.01785014954397,
          -0.01785017502377, -0.01785017519545, -0.01785017519660}

If we force f2b to be evaluated with exact inputs (delaying the numericization of the result) we get the expected plot:

f2b2[b_?NumericQ] := N[f2b[SetPrecision[b, Infinity]]] 

Plot[{f2b2[E^b], 0}, {b, -50, 0}, PlotStyle -> {{Blue, Thick}, {Red, Thick}}]

enter image description here

Brett Champion
  • 20,779
  • 2
  • 64
  • 121
  • Thank you for your help; the answer by Brett Champion solves my problem! I tried to increase the WorkingPrecision earlier which did not work. Thank You! Silky – silky Jun 20 '12 at 14:01
4

Keeping exact values until the last moment yields this:

f2b[b_] := 
 Exp[-1000 - 2 Sqrt[1000*b] - b]*(Erfi[Sqrt[1000]] - 
    Erfi[Sqrt[1000] + Sqrt[b]]);

ticks = Transpose[{Range[8]*10 - 9, Table[x, {x, -50, 20, 10}]}];

Show[ListLinePlot[Table[N[f2b[E^x]], {x, -50, 20}], Frame -> True,
  FrameTicks -> {{All, All}, {ticks, ticks}}],
 Graphics[Style[Line[{{51, 0}, {51, -1}}], Antialiasing -> False]]]

enter image description here

Chris Degnen
  • 30,927
  • 2
  • 54
  • 108
  • 1
    +1. N is superfluous in your code since ListLinePlot will apply N automatically (see the InputForm of ListLinePlot with exact values). – Alexey Popkov Jun 20 '12 at 14:39
3

Another alternative is to set WorkingPrecision to Infinity:

f2b[b_?NumericQ]:=Exp[-1000-2 Sqrt[1000*b]-b]*(Erfi[Sqrt[1000]]-Erfi[Sqrt[1000]+Sqrt[b]])
Plot[{f2b[E^b],0},{b,-50,0},PlotStyle->{{Blue,Thick},{Red,Thick}},WorkingPrecision->Infinity]

plot

The above works but it is quite strange that setting WorkingPrecision to a value more than 150 results in a very long evaluation giving wrong result.

Alexey Popkov
  • 61,809
  • 7
  • 149
  • 368