I have some data, and I want to plot it by ListPlot3D:
image1 = Import["image1.dat", "TSV"];
image1 // Dimensions
(* -> {150000, 3} *)
I used:
ListPlot3D[image1[[1 ;; 50000]], MaxPlotPoints -> 5, PerformanceGoal -> "Speed"]
Although I tried to plot just one third of the whole data, the kernel crashes--let alone when I want to plot all of it.
If I use:
ListPlot3D[image1[[1 ;; 10000]], MaxPlotPoints -> 5, PerformanceGoal -> "Speed"]
it returns an empty plot.
Can somebody tell me if they reproduce the crashing by plotting the data? How can I stop the kernel crashing when I plot my data? Does this happen because there are so many points?
The plot is actually consisted of fifteen 2 dimensional decay curves which I want in 3D, and each decay curve is consisted of 10000 points. I added to each point two other coordinates to be able to plot it in 3D.
I use Windows 7, 64 bit and Mathematica 9. I have enough RAM too, so I don't think it is because of RAM shortage.
It seems the solution in this post works for me, but I want each of those 15 decay curve to be plotted separately, and by using the proposed solution the plot looks like a surface. Also, I want to know the reason for the crash.
Here is a sample of what I'm looking for:
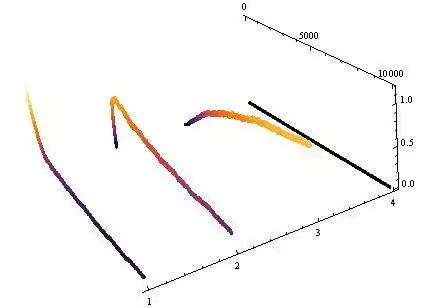
I used ListPointPlot3D to get this, however, it is extremely slow if I rotate the plot to inspect it more. That's why I tried ListPlot3D.
ListPlot3Dwill give you a surface rather than 15 separate curves. Why not stick withListPointPlot3Dbut only plot every 20th data point? – Simon Woods Jan 12 '15 at 13:49ListPlot3Dis that later I need a surface like plot. – MOON Jan 12 '15 at 13:53ArrayResampleto pick every nth datapoint from each list and useListPointPlot3Don the list of lists – gpap Jan 13 '15 at 17:37