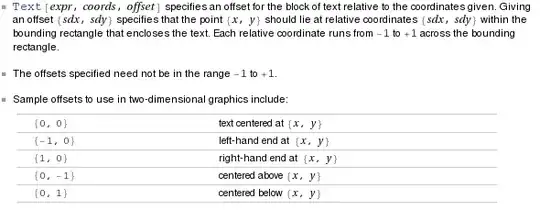
I want to place text within a plot. The text is always centered relative to the coordinates. How can I left-align or right-align the text relative to the coordinates? For example:
Show[
  Plot[hLim1[x], {x, 0.001, 0.99},
    AxesLabel -> {"Prob of Causality", "Prob of Causality Given Simul"}],
  Graphics[Text[Style["X2 Function", FontSize -> 14, Red], {0.5, 0.5}]]]
centers the text at {0.5, 0.5}. How can I make the left most part of the text at {0.5, 0.5}? I have tried the TextAlignment option in Style, but it does not do it.
I have also tried the AlignmentPoint option in Graphics, but that does not change anything either.


Epilogto put some text or other graphics primitives in a plot. – Öskå Jan 15 '15 at 12:12