3

I use the following code:

sol = DSolveValue[{y'[t] == 1/(2 y[t] + 3), y[0] == 1}, y, t];
Plot[sol[t], {t, -10, 10}, ImageSize -> Small]

Then I Ctrl+click the image (Macbook Pro) and save the image as test.pdf.

Then, in the same folder, I write the following latex code:

\documentclass[12pt]{article}
\usepackage{graphicx}
\begin{document}
\includegraphics{test.pdf}
\end{document}

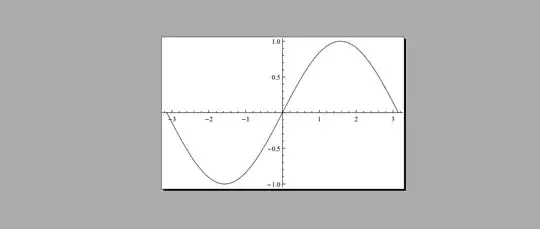
I compile using pdflatex and I get the following image.

enter image description here

Is this a bug?

David
  • 14,883
  • 4
  • 44
  • 117
  • Can you include what Mma version and OS you are using. There are some known problems with PDFs in V10 – Mike Honeychurch Jan 20 '15 at 04:57
  • Very closely related: http://mathematica.stackexchange.com/q/68893/131 – Yves Klett Jan 20 '15 at 05:58
  • I am using Mathematica 10.0.2, macbook pro Yosemite 8.0.2, machete texlive 2014. I Ctrl+clicked the image in my notebook, selected Save Graphic As..., then selected PDF from the format list. – David Jan 20 '15 at 15:25

2 Answers2

1

This looks like a bug related to exporting via the context menu. Try exporting using:

sol = DSolveValue[{y'[t] == 1/(2 y[t] + 3), y[0] == 1}, y, t];
p = Plot[sol[t], {t, -10, 10}, ImageSize -> Small]
Export[NotebookDirectory[] <> "test.pdf", p, "PDF"]
MBryn
  • 566
  • 4
  • 8
0

In generally, I used the method as below:

Plot[Sin[x], {x, -\[Pi], \[Pi]}]

Select the output cell -> Save selected as -> sample.pdf

enter image description here

\documentclass[b5paper,UTF8]{article}
\usepackage{graphicx}                               
\begin{document}
\texttt{Plot[Sin[x], {x, -Pi, Pi}]}

 \vspace{1mm}
 \fbox{\includegraphics[width=.9\textwidth]{sample.pdf}}
 \vspace{1mm}
\end{document}

enter image description here

xyz
  • 605
  • 4
  • 38
  • 117