3

I am wondering why the following does not plot the way it's written and exactly how does the Do[] function operate? I think I could be using it incorrectly.

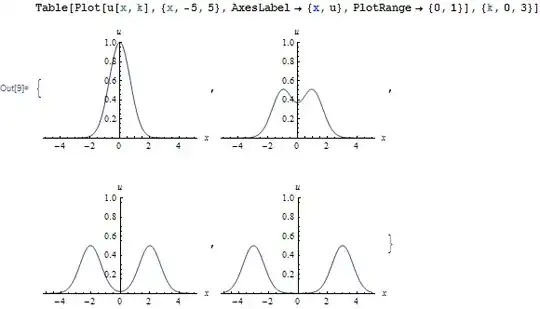
In[1]:= u[x_, t_] := (1/2) (Exp[-(x + t)^2] + Exp[-(x - t)^2])
        Do[
           Plot[u[x, k], {x, -5, 5}, 
           AxesLabel -> {x, u}, 
           PlotRange -> {0, 1}],
           {k, 0, 3}
          ]

EDIT

Clear["Global`*"]

a = 1;
b = 1;

ϕ[ξ_, ν_, t_] := 
  Sum[(((5*(-1 + (-1)^j)*(-1 + (-1)^i))/(j*i*Pi^2))*
      Cos[(1/Pi^4)*Sqrt[i^4*Pi^4 + j^4*Pi^4]*t])*Sin[i*Pi*ξ]*Sin[j*Pi*ν], {i, 1, 
    10}, {j, 1, 10}];

Do[Print[Plot3D[ϕ[ξ, ν, m], {ξ, 0, a}, {ν, 0, b}, Mesh :> Automatic, 
   PlotLabel :> StringJoin["Surface Plot of Solution at t = ", ToString[m]], 
   ColorFunction :> {"BlueGreenYellow"}]], {m, 0, 10, 2}]
Mr.Wizard
  • 271,378
  • 34
  • 587
  • 1,371
night owl
  • 1,719
  • 3
  • 15
  • 27

3 Answers3

12

The reason is that since version 6 of Mathematica, the Plot returns its output just like any other function. It does not print is as a side effect. Do is meant to be used with operations that have side effects and simply discards the output, so you never see the plot.

You can either use Table, which collects the values in a list:

Mathematica graphics

Note how you get a list of graphics objects. Graphics are expressions like any other, they're simply shown using a special formatting. You can always see their internal structure by using InputForm on them or pressing Ctrl-Shift-I on the containing cell.

Or you can use Print explicitly:

Do[Print@Plot[u[x, k], {x, -5, 5}, AxesLabel -> {x, u}, 
   PlotRange -> {0, 1}], {k, 0, 3}]

Note: If as @JM noted, you are trying to animate the plot, use Animate:

Animate[Plot[u[x, k], {x, -5, 5}, AxesLabel -> {x, u}, 
  PlotRange -> {0, 1}], {k, 0, 3, 1}]
Szabolcs
  • 234,956
  • 30
  • 623
  • 1,263
  • I have a strong feeling OP's code was taken from an old Mathematica book, and the intention was to animate the plot; you might thus want to mention Animate[]. – J. M.'s missing motivation Jun 22 '12 at 08:27
  • @J.M.: No this was not the intention, I was trying to find a more convenient way of making multiple plots when necessary by the the computer do the work for me in a more programmatic fashion rather than copy/paste several Plot commands or use Manipulate over a certain range (parameter). But that does sounds interesting now that you bring that idea up. Thanks :) – night owl Jun 22 '12 at 09:56
  • @nightowl You can use Row/Column/Grid to arrange the plots in a nicer layout – Szabolcs Jun 22 '12 at 09:57
  • @night owl: I see; as I said, it's exactly how animations were done in old Mathematica, so that's what I thought you were doing. Then indeed, Table[] is what you want (though that too was used for producing animations as well for subsequent exporting). – J. M.'s missing motivation Jun 22 '12 at 10:07
  • @Szabolcs: Thanks! I will look into how to arrange them nicely using the suggestions you've given. – night owl Jun 23 '12 at 02:20
  • @J.M.: Oh really, hmm interesting. Did not know that. See, the only thing I do not like about using Table for graphics is that it includes the braces { } around the graphic and has the commas to separate them. Is this shown in the graphic itself when exporting the figure? Oh and by the way, thanks again for the Animate suggestion. First time using it. Usually I go with Manipulate. I quite like it. u[x_, t_] := 1/2 (Exp[-(x + t)^2] + Exp[-(x - t)^2]) Animate[Plot[u[x, m], {x, -5, 5},PlotRange :> {0, 1},PlotStyle :> {Thick, Blue},AxesLabel :> {x, u},AspectRatio :> 1],{m, 0, 5, 0.025}] – night owl Jun 23 '12 at 02:22
  • @J.M.: BTW, nice Avatar on your homepage. Pretty awesome! :) – night owl Jun 23 '12 at 02:38
  • @night owl: "See, the only thing I do not like about using Table for graphics is that it includes the braces" - well, you will have to look into Grid[]/GraphicsGrid[] as Szabolcs suggests. You can use it with Table[] (and possibly Partition[]) so that things are laid out nicely. – J. M.'s missing motivation Jun 23 '12 at 02:44
  • @J.M.: Yes, that's exactly what I use to get the job done -> GraphicsGrid, but I have to try out Table w/ Partition to see how that looks. :) Thanks – night owl Jun 23 '12 at 03:09
  • @Szabolcs: How do would I implement GraphicsGrid to the problem? Or what is the most efficient way to organize the graphics? I will edit the question because it is too much code to fit here in the comments. Or should I make this a new question? – night owl Jun 23 '12 at 06:43
1

Another way is to use DisplayFunction, something before the time of graphic input/output of version 6. The following line prints the same way as Szabolcs's 2nd example.

Do[Plot[u[x, k], {x, -5, 5}, AxesLabel -> {x, u}, PlotRange -> {0, 1},
   DisplayFunction -> Print], {k, 0, 3}]

DisplayFunction -> f wraps the actual output of any Graphics function (Plot here) into f. This way one can directly send the plot to any pipe, for example to a stream or file. If you are version 6+ though, the best solution is to use Table, just as Szabolcs has said.

István Zachar
  • 47,032
  • 20
  • 143
  • 291
  • Thanks for that alternative method. Could you read the last comment under Szabolcs post. I want to try and use GraphicsGrid with the Do command. Also, another concern came up. What is the most efficient way of using the iterator for the Do command. Because at most it take three arguments, e.g. Do[expr,{k,min,max,step-size}]. But what if you have a function such as $\phi[\xi_,\nu_,t]$, and you want to plot for value of time say: $t=0,0.3,0.7,0.10,0.14,0.16$. As you can notice, the time instances (steps) are not by the same amount, so how could you account for this when using – night owl Jun 23 '12 at 08:10
  • the Do command. Or is there something you can add.. Or would you just have to input the times in manually for a case like this? – night owl Jun 23 '12 at 08:11
  • 2
    @nightowl the syntax you are looking for is Do[f[x], {x, {0, 0.3, 0.7, 0.10, 0.14, 0.16}}] -- this also works for Table. Also realize you could use Scan or Map, e.g. Scan[f, {0, 0.3, 0.7, 0.10, 0.14, 0.16}] – Mr.Wizard Jun 23 '12 at 08:29
  • @Mr.Wizard: Oh my! Thank You. This helps alot! :). So could you ("usually") input list in place of an iterator if you have several values to input with staggering increments of time? Now only to get GraphicsGrid to work in junction with it and that will complete my handy toolbox for the moment. :) Do each graphic have a internal name associated with them or could one be assigned to them. Because I know that GraphicsGrid[{{g_11,g_12,...},...}] needs to have variables (functions) hence -> ($g_{11},g_{12}$) assigned for input to create the 2-D grid. – night owl Jun 23 '12 at 08:57
  • @nightowl I'm not sure what you're trying to do but it's quite possible you don't realize you can pass a table of graphics objects directly to GraphicsGrid: GraphicsGrid[ Table[Plot[k Sin[x] + x, {x, 0, 3 Pi}], {k, 4}] ~Partition~ 2 ] (Here I generate four plots with Table, split it into a 2x2 table with Partition, and pass the result to GraphicsGrid.) – Mr.Wizard Jun 23 '12 at 09:38
  • @Mr.Wizard: Okay, so is that saying kSin[x], so is it plotting: {Sin[x],2 Sin[x], 3 Sin[x], 4 Sin[x]}? I don't want to change the original function by a multiplying scalar due to the Table iterator. If that's what it is doing from {k,4}. Could it be done on something like what I put in the question underneath EDIT*? But keeping Do[ ] and not using Table[ ]. – night owl Jun 23 '12 at 12:01
1

Since this is getting a bit lengthy for comments:

What is the most efficient way of using the iterator for the Do command. Because at most it take three arguments, e.g. Do[expr,{k,min,max,step-size}]. But what if you have a function such as ϕ[ξ,ν,t], and you want to plot for value of time say: t=0,0.3,0.7,0.10,0.14,0.16. As you can notice, the time instances (steps) are not by the same amount, so how could you account for this

The syntax you are looking for is:

Do[f[x], {x, {0, 0.3, 0.7, 0.10, 0.14, 0.16}}]

This also works for Table. In simple cases such as this example you could use Scan or Map:

Scan[f, {0, 0.3, 0.7, 0.10, 0.14, 0.16}]

Do each graphic have a internal name associated with them or could one be assigned to them. Because I know that GraphicsGrid[{{g_11,g_12,...},...}] needs to have variables (functions) hence -> (g11,g12) assigned for input to create the 2-D grid.

No, the elements of the table given to GraphicsGrid do not need to be assigned to symbols first. Here is an example using the function given in your question:

u[x_, t_] := (1/2) (Exp[-(x + t)^2] + Exp[-(x - t)^2])

plots =
 Table[
   Plot[u[x, k], {x, -5, 5}, AxesLabel -> {x, u}, PlotRange -> {0, 1}],
   {k, 0, 3}
 ];

Partition[plots, 2] // GraphicsGrid

Mathematica graphics

Mr.Wizard
  • 271,378
  • 34
  • 587
  • 1,371
  • Okay, Thanks. I don't see what Scan does. It must be something internally but does not return anything to the screen. And Map just seems to do something weird like {Cos[x][0],Cos[x][0.3],...} with f being Cos[x], from your example shown. And I'm glad to see that it works for Table, but my question was how to get it to work with the example I provided in the question underneath EDIT using the Do command. – night owl Jun 23 '12 at 21:45
  • @nightowl Scan is to Map as Do is to Table. Try: Scan[Print, {1, 2, 3, 4, 5}] – Mr.Wizard Jun 23 '12 at 23:33