How can I make a interval breakdown chart like this:

Update: I checked BarChart and Gauge they do not have this capacity.
How can I make a interval breakdown chart like this:
Update: I checked BarChart and Gauge they do not have this capacity.
Here's one way to to it with BarChart. I didn't spend too much time on formatting the Tooltip.
names = {"apps", "pics", "vids", "free"};
vals = {10, 25, 50, 15};
BarChart[
 Table[Tooltip[vals[[i]], Column[{
     Style[names[[i]], 16, Bold],
     Style[ToString[vals[[i]]] <> " GB", 16, GrayLevel[0.5]]}],
   TooltipStyle -> {CellFrameColor -> GrayLevel[0.9],
     Background -> GrayLevel[0.9]}], {i, 1, 4}],
 ChartLayout -> "Stacked", BarOrigin -> Left, Axes -> False,
 AspectRatio -> 1/8]

It is perhaps easier (or almost so) to build this kind of chart from graphics primitives as to build it with BarChart. Here is a function that works that way.
breakdownChart[
    vals_List, lbls_List,
    wd_Integer /; wd >= 100,
    ht_Integer /; ht >= 20] /; Length@vals == Length@lbls :=
  With[{totl = Total @ values},
    With[{barSize = Round[wd values/totl]},
      Module[{offset = 0, next, bar},
        Framed[
          Graphics[{
            Table[
              bar = {
                Hue[offset/wd],
                Tooltip[
                  Rectangle[{offset, 0}, {next = offset + barSize[[i]], ht}],
                  Column[{Style[labels[[i]], "SB", 14], values[[i]]}],
                  TooltipStyle -> Background -> GrayLevel[.92]],
                Black,
                Line[{{next, 0}, {offset, 0}, {offset, ht}, {next, ht}}]};
              offset = next;
              bar,
              {i, Length@values}],
            Line[{{offset, 0}, {offset, ht}}]},
            PlotRange -> {{0, wd}, {0, ht}},
            ImageSize -> {wd, ht}],
          RoundingRadius -> 5]]]]
To see how it looks, some test data is needed.
SeedRandom[3]; values = RandomInteger[100, 8]
{61, 32, 80, 9, 58, 35, 96, 17}
SeedRandom[1111]; labels = RandomSample[DictionaryLookup[__ ~~ "ing"], Length @ values]
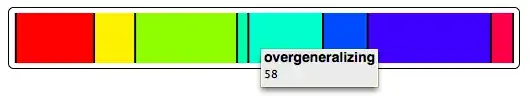
{"bluffing", "fawning", "threading", "upbraiding",
 "overgeneralizing", "validating", "biding", "owing"}
Here is a chart with dimensions 400 by 40 pixels made with the test data.
breakdownChart[values, labels, 400, 40]

To those who wonder why I used
Black, Line[{{next, 0}, {offset, 0}, {offset, ht}, {next, ht}}]
rather than applying
EdgeForm[Black]
to the rectangles (my first thought), it is because, on OS X, EdgeForm gave a ugly looking result with doubled vertical black lines between the bar segments.
I am edited this post, revising the function breakdownChart to use vertical dividers rather than full outlines around the segment rectangles. The new code is a little simpler and produces a better looking chart.
breakdownChart[
    vals_List, lbls_List,
    wd_Integer /; wd >= 100,
    ht_Integer /; ht >= 20] /; Length@vals == Length@lbls :=
  With[{totl = Total @ values},
    With[{barSize = Round[wd values/totl]},
      Module[{offset = 0, divider, next, bar},
        divider = {Black, AbsoluteThickness[1.5], Line[{{#, 0}, {#, ht}}]} &;
        Framed[
          Graphics[{
            Table[
              bar = {
                Hue[offset/wd],
                Tooltip[
                  Rectangle[{offset, 0}, {next = offset + barSize[[i]], ht}],
                  Column[{Style[labels[[i]], "SB", 14], values[[i]]}],
                  TooltipStyle -> Background -> GrayLevel[.92]],
                divider[offset]};
              offset = next;
              bar,
              {i, Length@values}],
            divider[offset]},
            PlotRange -> {{0, wd}, {0, ht}},
            PlotRangePadding -> {Scaled[1/wd], Automatic},
            ImageSize -> {wd, ht}],
          RoundingRadius -> 5]]]]

breakdownChart[values, labels, 400, 40]
Bottom-up approach using Accumulate:
{10, 25, 50, 15} // Prepend[0] // Accumulate // Partition[#, 2, 1] & //
  Map[{ColorData["HTML", RandomInteger[{1, 10}]],
      Rectangle[{First[#], 0}, {Last[#], 1}]}~
     Join~ {Black, Text[Last[#], {Last[#], -1/4}]} &] //
 Graphics[#, AspectRatio -> 1/5] &

RandomInteger color selection is not recommended, only used for brevity.
BarChartdocumentation? (See under Scope > Data and Layouts.) – Jan 20 '15 at 14:19Multivalue Gauges. – Bob Hanlon Jan 20 '15 at 14:31http://reference.wolfram.com/language/ref/BulletGauge.html– alancalvitti Jan 20 '15 at 15:31BarChart[RandomReal[1, {4}], ChartLayout -> "Stacked", BarOrigin -> Left]? – Michael E2 Jan 20 '15 at 19:32