myfun[j_, mu_, sigma_] :=
    With[{kdata = 5},
    PDF[BinomialDistribution[kdata, 1/(1 + Exp[-x])], j]*
    PDF[NormalDistribution[mu, sigma], x]
]


Plot[Table[myfun[j, -4, 9], {j, 0, 5}], {x, -10, 10}, PlotLegends -> Automatic]
Why does this not have different color?

I would expect curves with different colors and some "Automatic" legends?
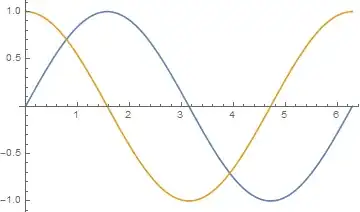
The example here works fine:
Plot[{Sin[x], Cos[x]}, {x, 0, 2 \[Pi]}, PlotLegends -> Automatic]
I would think that Table[] creates a {} structure, just like the {Sin[x], Cos[x]}. So why not have color??
After changing to this:
tmp = Table[myfun[j, -4, 9], {j, 0, 5}]
Plot[tmp, {x, -10, 10}, PlotLegends -> Automatic]

Now they have color, but the "unwanted" PlotLegends.
Is there a better way? Or an explanation?
I want to have the expressions as legends as well as color.
