I enter this:
sol17 = DSolveValue[{y'[x] == 2 - y[x], y[0] == 3}, y[x], x];
p1sol17 = Plot[sol17, {x, -3, 3},
  Epilog -> {Red, PointSize[Large], Point[{0, 3}],
    Text[Style["(0,3)", 10, Black, Background -> White], {0,
      3}, {-2, -2}]}]
And I get the following image:

I do this:
sol17 = DSolveValue[{y'[x] == 2 - y[x], y[0] == 1}, y[x], x];
p2sol17 = Plot[sol17, {x, -3, 3},
  Epilog -> {Red, PointSize[Large], Point[{0, 1}],
    Text[Style["(0,1)", 10, Black, Background -> White], {0, 1}, {-2,
      2}]}]
And I get the following image:

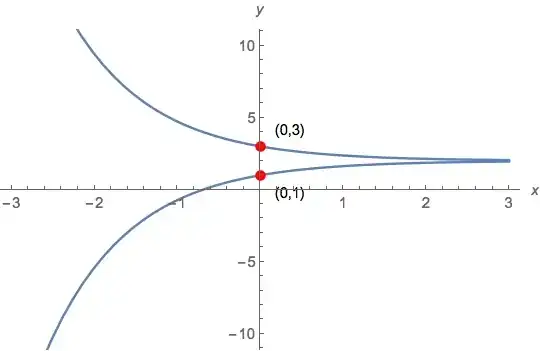
Now I try to combine them with the Show command:
Show[{p1sol17, p2sol17}, PlotRange -> {{-3, 3}, {-10, 10}}]
And I get this image:

Note how the bottom curve is incorrect? What is going on here?
Mathematica 10.0.2 on MacBook Pro using Yosemite.


Epilogis a graphics option.Showconcatenates the options, and only the first is applied (e.g. tryPlot[x^2,{x,-1,1},PlotStyle->Red,PlotStyle->Green]). – 2012rcampion Jan 24 '15 at 20:51