I've got a following code snippet:
olddatafile := "~/git/hpx/old_serialization_generated_data";
newdatafile := "~/git/hpx/new_serialization_generated_data";
oldplot :=
ListPlot[ReadList[olddatafile, {Number, Number}], Joined -> True,
PlotLegends ->
Placed[{Style["Boost", FontSize -> 20]}, {Left, Top}],
PlotStyle -> Blue]
newplot :=
ListPlot[ReadList[newdatafile, {Number, Number}], Joined -> True,
PlotLegends ->
Placed[{Style["HPX", FontSize -> 20]}, {Left, Top}],
PlotStyle -> Red]
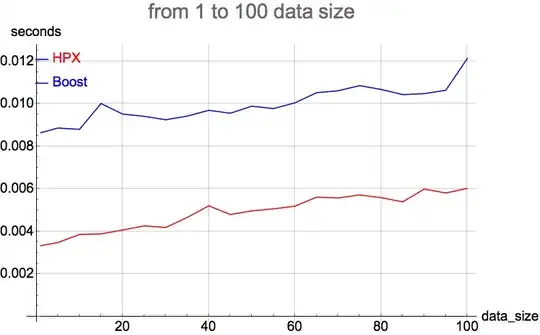
Show[oldplot, newplot, ImageSize -> Full,
PlotLabel -> Style["from 1 to 100 data size", FontSize -> 30],
AxesLabel -> {"data_size", "seconds"},
AxesStyle -> Directive[Black, 20], GridLines -> Automatic]
I expect it to show me two different plots (like it did before), but I get only first one. I made sure that DataRange option is the same for both plots (like it was answered here). If I don't combine them with Show, plots are displayed well separately.
Here are values of olddatafile and newdatafile:
ReadList[olddatafile, {Number, Number}]

In[80]:= {{1, 0.00863999`}, {5, 0.00885776`}, {10, 0.00879894`}, {15,
  0.0100123`}, {20, 0.00951515`}, {25, 0.00941007`}, {30,
  0.00924682`}, {35, 0.0094212`}, {40, 0.0096916`}, {45,
  0.00955581`}, {50, 0.00988706`}, {55, 0.00977177`}, {60,
  0.0100432`}, {65, 0.0105198`}, {70, 0.0106113`}, {75,
  0.0108512`}, {80, 0.0106733`}, {85, 0.0104314`}, {90,
  0.010475`}, {95, 0.0106352`}, {100, 0.0121299`}}
ReadList[newdatafile, {Number, Number}]

Out[81]= {{1, 0.00332785}, {5, 0.00347605}, {10, 0.00385404}, {15,
  0.00388163}, {20, 0.00406281}, {25, 0.00425853}, {30,
  0.00418382}, {35, 0.00465427}, {40, 0.00520275}, {45,
  0.00479219}, {50, 0.00496409}, {55, 0.00505981}, {60,
  0.00518383}, {65, 0.00560755}, {70, 0.00557286}, {75,
  0.00571052}, {80, 0.0055853}, {85, 0.0053877}, {90,
  0.00598863}, {95, 0.00580467}, {100, 0.00602062}}