When I type
ContourPlot[x == Sin[6*Pi*y], {x, -1, 1}, {y, -2, 2}]
I get this
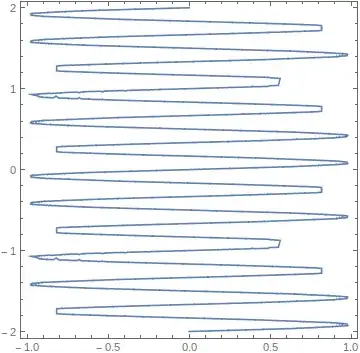
Now I'm not a particularly gifted mathematician, but I have a feeling this just might be wrong. How do I get Mathematica to plot it correctly?
When I type
ContourPlot[x == Sin[6*Pi*y], {x, -1, 1}, {y, -2, 2}]
I get this
Now I'm not a particularly gifted mathematician, but I have a feeling this just might be wrong. How do I get Mathematica to plot it correctly?
ContourPlot is not as smart as you so you have to give it more PlotPoints to sample domain or use more suited for this job function:
ParametricPlot[{Sin[6*Pi*y], y}, {y, -2, 2}]
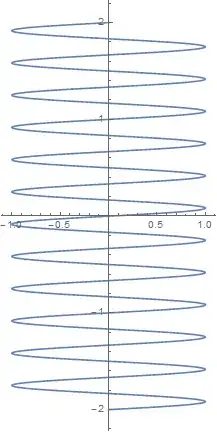
ContourPlot[x == Sin[6*Pi*y], {x, -1, 1}, {y, -2, 2}, PlotPoints -> 100]
Just increase MaxRecursion to track the curve correctly
ContourPlot[x == Sin[6*Pi*y], {x, -1, 1}, {y, -2, 2}, MaxRecursion -> 3]

Usually PlotPoints and MaxRecursion options solve almost all resolution problems.
ArcSin[]. – David G. Stork Jan 31 '15 at 20:59@Mr.Wizard. – Mr.Wizard Feb 01 '15 at 01:13