2

Please let me know if this is a duplicate. There are some solutions, but I think there must be something simpler for this kind of situation.

ListLinePlot[{1, 2, 3}, PlotLegends -> Placed[{"graph1"}, {0.8, 0.5}]]

produces a legend placed as I would like to:

enter image description here

If I have several plots, I can use show and duplicate the above:

Show[
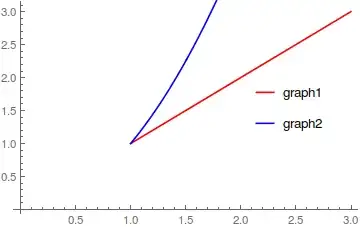
 ListLinePlot[{1, 2, 3}, PlotLegends -> Placed[{"graph1"}, {0.8, 0.5}], PlotStyle -> Red],
 Plot[x^2, {x, 1, 3}, PlotLegends -> Placed[{"graph2"}, {0.8, 0.5}],   PlotStyle -> Blue]
 ]

enter image description here

As I cannot use Plotlegends with Show, what to do to make the code simpler and not to use the commands repeatedly? I know that perhaps ShowLegend could help... I will have about 10 lines in my final plot.

wondering
  • 595
  • 3
  • 18

2 Answers2

3
Legended[Show[ListLinePlot[{1, 2, 3}, PlotStyle->Red], 
   Plot[x^2, {x, 1, 3}, PlotStyle->Blue]], 
 Placed[LineLegend[{Red, Blue}, {"graph1", "graph2"}], {0.8, 0.5}]]

enter image description here

Or, use a function to pass the styles into the plots in Show and into LineLegend:

Legended[Show[ListLinePlot[{1, 2, 3}, PlotStyle -> #], 
    Plot[x^2, {x, 1, 3}, PlotStyle -> #2]], 
   Placed[LineLegend[{##}, {"graph1", "graph2"}], {0.8, 0.5}]] & @@ {Red, Blue}
(* same picture *)

Or, collect the colors as they are specified into the list colors and use use colors as the first argument of LineLegend:

colors = {}; 
Legended[ Show[ListLinePlot[{1, 2, 3}, PlotStyle -> (AppendTo[colors, Red]; Red)], 
  Plot[x^2, {x, 1, 3}, PlotStyle -> (AppendTo[colors, Blue]; Blue)]], 
 Placed[LineLegend[colors, {"graph1", "graph2"}], {0.8, 0.5}]]
(* same picture *)

Or, use Reap/Sow:

Legended[reap = 
  Reap[Show[ListLinePlot[{1, 2, 3}, PlotStyle -> Sow[Red]], 
    Plot[x^2, {x, 1, 3}, PlotStyle -> Sow[Blue]]]]; reap[[1]], 
 Placed[LineLegend[reap[[2, 1]], {"graph1", "graph2"}], {0.8, 0.5}]]
(* same picture *)

Or, use a prespecified color list:

cols="DefaultPlotStyle"/.(Method/.Charting`ResolvePlotTheme["Vibrant", ListLinePlot] );

Legended[ Show[ListLinePlot[{1, 2, 3}, PlotStyle -> cols[[1]]], 
  Plot[x^2, {x, 1, 3}, PlotStyle ->  cols[[2]]]], 
 Placed[LineLegend[cols, {"graph1", "graph2"}], {0.8, 0.5}]]

enter image description here

kglr
  • 394,356
  • 18
  • 477
  • 896
  • +1 Thank you, this works But how about if I wanted the line style of the graph (e.g. color) to be automatically transferred to the legend? So as not to mix up the graphs, if there are more of them. – wondering Feb 03 '15 at 05:49
  • @wondering, please see the updated post with some ways to collect the color information to be used in LineLegend. I don't know of a way to automatically extract PlotStyle information of a graphics object once it is rendered. – kglr May 04 '15 at 17:48
  • Thank you. But would you have an idea how to specify here one of the color schemes (Automatic, "Classic","Vibrant","Monochrome"), instead of specifying the colors manually? – wondering May 04 '15 at 17:59
  • @wondering, just added an example showing how you can use a prespecified color list. – kglr May 04 '15 at 18:12
  • That is exactly it, thank you so much! – wondering May 04 '15 at 21:34
1

To address your question after the answer of kguler. You might want to create functions that take care of that automatically, such as e.g.:

    myPlot[f_, xmin_, xmax_, pos_List, color_] := 
  Plot[f[x], {x, xmin, xmax}, PlotStyle -> color, 
   PlotLegends -> 
    Placed[LineLegend[{ToString[f] <> "[x]"}], Scaled[pos]]
   ];
myLLPlot[lst_List, pos_List, name_String, color_] := 
  ListLinePlot[lst, PlotStyle -> color, 
   PlotLegends -> Placed[PointLegend[{name}], Scaled[pos]]
   ];

Here pos is a list giving the scaled position of where the legend to appear, and color is the color of both the plot and the legend.

To give an example, let us plot the following together using Show:

    g[x_] := x^2;
lst = {{0, 0}, {1, 1}, {2, 2}, {3, 3}};

This is done as follows:

    Show[
 myPlot[g, 0, 2, {0.8, 0.1}, Red],
 myLLPlot[lst, {0.8, 0.15}, "list", Blue]
        ]

yielding

enter image description here

On the other hand, I do not really see, what is the gain. Using Show one anyway needs to fix somehow the colors of the plots let alone their names in the legends. To my personal test I would rather use something like the following:

 Show[{
  ListLinePlot[lst, PlotStyle -> Blue
   ],

  Plot[g[x], {x, 0, 3}, PlotRange -> {{0, 3.5}, Automatic}, 
   PlotStyle -> Red]
  },
 (* The legends are in the Epilog starting here *)
 Epilog -> Inset[Panel[Column[{
      LineLegend[{Blue}, {"  Data"}],
      LineLegend[{Red}, {"g[x]"}]
      }]], Scaled[{0.8, 0.2}]]
 (* End of the Legends*)

 ]

giving this:

enter image description here

since the panel gives a more accurate view of the legend. Have fun!

Alexei Boulbitch
  • 39,397
  • 2
  • 47
  • 96