For my work, I am examining the values of a complex function as I vary the input according to a real parameter, and I want to both give the general plot and the plot of specific points, with labels (so one sees the direction of increase).
I knew from the documentation that Point and Epilog together allow you to label points on graphs; e.g.,
ourF[z_] := z^2;
parts[z_] := {Re[z], Im[z]}
ParametricPlot[parts[ourF[x + I/4]], {x, -3 , 3},
 Epilog -> {{PointSize[Medium],
    Point[Table[parts[ourF[ j + I/4]], {j, -3, 3}]]}}]
This produces:

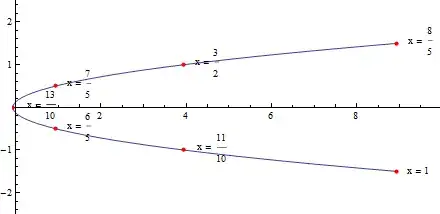
Looking at the answers to this site's Question 1854 (especially Jacob Jurmain's), Listplot in newer versions of Mathematica has a Labeled option that labels the points in the Listplot. Indeed, I can get what I want by making a Plot and Listplot separately and then Showing them together. e.g.
ourF[z_] := z^2;
parts[z_] := {Re[z], Im[z]}
plotOne = ParametricPlot[parts[ourF[x + I/4]], {x, -3 , 3}];
plotTwo = ListPlot[Table[Labeled[parts[ourF[ j + I/4]],
     Row[{"x = ", j}], Right
     ], {j, -3, 3}]];
Show[plotOne, plotTwo]
which yields

as required.
My first attempt, however, was to simply put the ListPlot in the Epilog, e.g.
ourF[z_] := z^2;
parts[z_] := {Re[z], Im[z]}
ParametricPlot[parts[ourF[x + I/4]], {x, -3 , 3},
 Epilog -> {ListPlot[Table[Labeled[parts[ourF[ j + I/4]],
      Row[{"x = ", 13/10 + j/10}], Right
      ], {j, -3, 3}]]}]
This yields the error:
Graphics is not a Graphics primitive or directive.
I guess ParametricPlot calls Graphics, and Listplot is now calling Graphics inside the other Graphics, hence the issue.
I also tried putting Labeled in the Point variation, but Point doesn't know what to do with the label, and the error message becomes
Coordinate Labeled[{8.9375, -1.5}, Row[{"x = ", 1}], Right] should be a pair of numbers, or a Scaled or Offset form.
Q: Is there any way of putting it all in one plotting command?
P.S.: An answer in the vein of, "You have acceptable output, stop worrying about it" would also be reasonable. I am new to Mathematica, but it seems to the newcomer as though Mathematica puts in one line what I would use 5-10 lines in MATLAB to set up, and [after having debugged] the fewest number of lines is the best.


FirstonListPlot. Related: 73402, becauseEpilogessentially accepts the same whatGraphicsdoes. – Kuba Feb 12 '15 at 19:39