For some reason the result of Plot of the following function:
Clear[x]; Clear[a]; Clear[b];

m={{(1+1/k)/x^2,1/k},{-1/k,x^2(1-1/k)}};
{{l1,l2},{v1,v2}}=Eigensystem[m];
g = Solve[{0,1}==a v1 + b v2,{a,b}];
alpha = First[a /. g];
beta = First[b /. g];
d[x_, h_, n_]:= alpha l1^n v1 + beta l2^n v2 /. k-> (2 Log[x])/h
Plot[Last[d[x,4,8]], {x,6.78,8}, PlotStyle->Orange]
is this
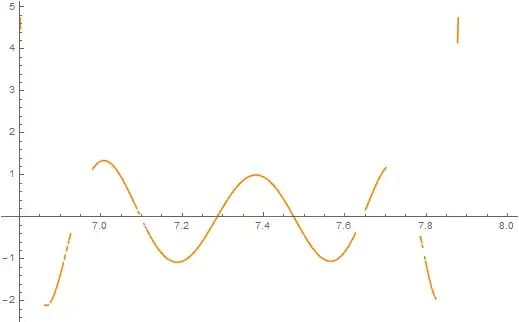
How can I remove those blank spaces to see the plot of a continuous function?
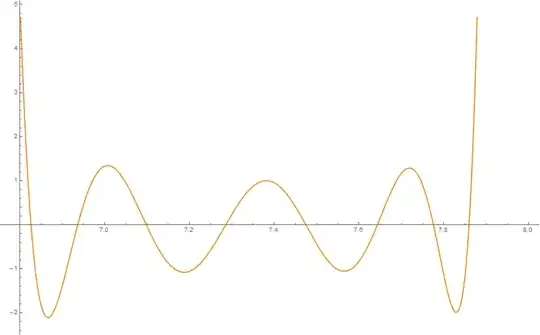
Chopyour function, then everything is fine. – Yves Klett Feb 19 '15 at 15:39Plotcomplex values; would you help me find a good one to mark as the original in this case? – Mr.Wizard Feb 19 '15 at 18:30