3

I've made a 3D plot of a pressure surface over the region 160W-20W, 20N-80N - the right panel 3D plot of a pressure surface over the region 160W-20W, 20N-80N - the right panel 
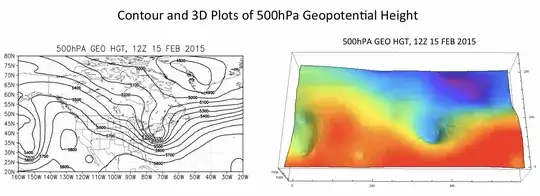
and I would like to put a map under it, probably just continental outlines for simplicity. I'm just updating to Mathematica 10. The plot on the left was made with other software and is just included to show the geographic domain. The plot on the right was made with:

ListPlot3D[data, Mesh -> False, BoxRatios -> {0.8*140, 60, 20}, ViewPoint -> Front, ColorFunction -> ColorData["Rainbow"]]

Thanks!

J. M.'s missing motivation
  • 124,525
  • 11
  • 401
  • 574
Matt
  • 31
  • 2
  • Could you show more of your code? i.e. The functions you are using to plot each. – wgwz Feb 19 '15 at 15:22
  • This question might be of help. http://mathematica.stackexchange.com/questions/26301/weather-maps-with-mathematica – Zviovich Feb 19 '15 at 15:27

2 Answers2

2

Also:

g1 = {EdgeForm@Black,LightGray,Opacity@.1, CountryData[#, "Polygon"]&/@ CountryData["SouthAmerica"]};
DensityPlot[Sin[x] Sin[y], {x, -4, 4}, {y, -3, 3}, ColorFunction -> "SunsetColors", Frame -> None, 
           Epilog -> Inset@Graphics@g1]

Mathematica graphics

Answering your request, using your latitude and longitude:

coords = List @@ CountryData["World", "FullPolygon"];
c1 = Map[Select[#, -160 < #[[1]] < -20 && 20 < #[[2]] < 80 &] &, coords, {2}];
g1 = Graphics[{Line /@ c1, Opacity[.1], Rectangle @@ {{-160, 20}, {-20, 80}}}, PlotRangePadding -> None]
ar = AspectRatio /. AbsoluteOptions[g1, AspectRatio][[1]];

DensityPlot[Sin[x] Sin[y], {x, -4, 4}, {y, -3, 3}, Frame -> None, 
 Epilog -> Inset[g1, Center, Center, Scaled[1]], AspectRatio -> ar, 
 PlotRangePadding -> None]

Mathematica graphics

Dr. belisarius
  • 115,881
  • 13
  • 203
  • 453
1

Assuming your map is a ContourPlot[] and your geopotential thing is a Plot3D[]. I think something like the following example could work:

one = ContourPlot[Sin[x] Sin[y], {x, 0, 2 Pi}, {y, 0, 2 Pi}, ContourShading -> None]
two = DensityPlot[Sin[x] Sin[y], {x, 0, 2 Pi}, {y, 0, 2 Pi}]
Show[{two,one}]

If your data for the pressure/geopotential is a list then use ListDensityPlot[] in step two. So long as your plots are both 2D, which should be doable I think a simple usage of the Show[] function will do the trick.

(*Output of the above code*)

enter image description here

wgwz
  • 256
  • 1
  • 7
  • Thanks for the reply. I'm using ListPlot3D and I'd like to add a geographical map in the background over the range 160W-20W, 20N-80N. – Matt Feb 21 '15 at 14:07