I an trying to do a very simple smooth Sin wave...
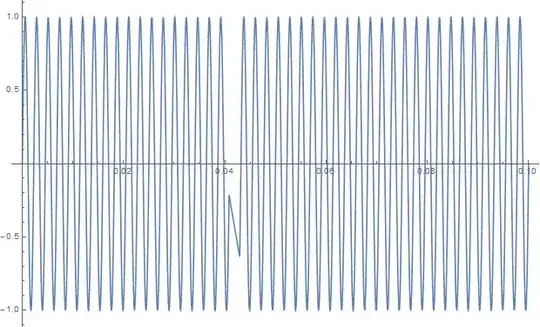
Plot[Sin[ 2 Pi 440 t], {t, 0.0, 0.1}]
...but I am getting an unexpectedly non-smooth plot for it...
What is going on at 0.04 - 0.05 in this plot?
I am using Mathematica 10.0.02 Home.
Thanks!
PlotPoints
PlotPoints->101
PlotPointsoption to increase the number of initial samples, e.g.,PlotPoints->101. – Bob Hanlon Feb 23 '15 at 15:46PlotPointsissue. To fix, just increase the number of points sampled. – DumpsterDoofus Feb 23 '15 at 16:03