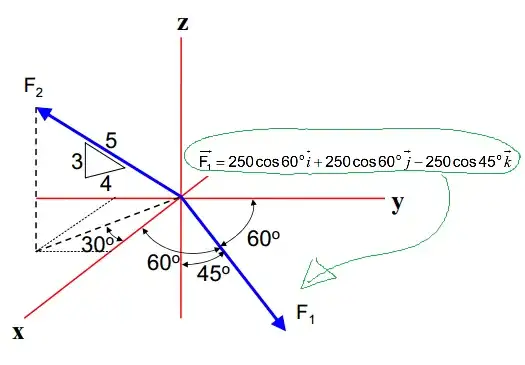
I have a vector (in physic) designated as F1=250cos(60)i+250cos(60)j+250cos(45)k, and i would like to see it in a 3D graphic with the axis centered at the origin, after what i would include other vector from there. But i have been unable to graph it. I have tried this:
    Plot3D[{250*cos[60], 250*cos[60], -250*cos[45]}, {x, -20, 20}]

    VectorPlot3D[{250*cos[60]*x, 250*cos[60]*y, -250*cos[45]*z}, {x, -20,
                20}, {y, -20, 20}, {z, -20, 20}]
    Plot3D[{250*cos[60]*x, 250*cos[60]*y, -250*cos[45]*z}, {x, -20,
           20}, {y, -20, 20}]
I know why it doesn`t work, (i,j,k are not variabe but a direction!) but i still dont see how to get the vector to show up?
Any suggestion.
(first time user, would appreciate as much info as possible)
Thanks in advance
Seb.

Degreeto convert that value to radians. Furthermore, in your last line of code, z is undefined. – Sjoerd C. de Vries Feb 27 '15 at 16:40