In the plot produced by the following code, I want to draw a contour line for $f(x,y)=0.8$. Here $f(x,y)=\sin(x^2+y)$, however, actually we don't know $f$, we've got the data only.
data = Flatten[Table[{x, y, Sin[x^2 + y]}, {x, 0, 1, 0.1}, {y, 0, 1, 0.1}], 1];
ListDensityPlot[data, ImageSize -> Large, PlotLegends -> Placed[BarLegend[Automatic,LegendMargins -> {{0, 0}, {10, 5}}], Right], ColorFunction -> "Rainbow", FrameLabel -> {"x", "y"}, LabelStyle -> Directive[Bold, 20]]
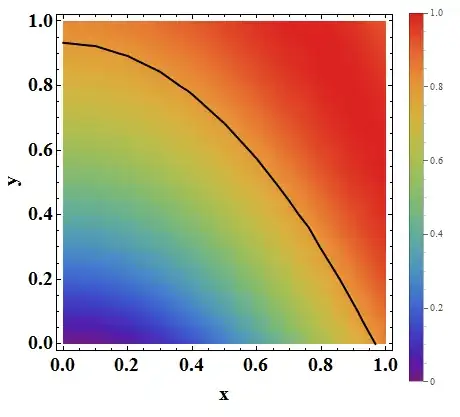


ListDensityPlot[..., MeshFunctions -> {#3 &}, Mesh -> {{0.8}}]– Mar 03 '15 at 05:49