Mathematica has quite a nice ScalingFunctions option to BarChart, BubbleChart and the various financial charting functions, which simplifies log scaling, reverse scales and so on. Consider:
test = FoldList[0.85 #1 + #2 &, 0.,
Abs@RandomVariate[NormalDistribution[0, 3], 25]]
{0., 1.40961, 4.59418, 9.49233, 11.4004, 9.93797, 11.0347, 11.0437,
9.39412, 8.46501, 10.5416, 10.3413, 9.60696, 8.47968, 9.45521,
9.44406, 12.3554, 15.3821, 17.8863, 15.5349, 17.2376, 18.3164,
18.5506, 16.459, 14.6381, 13.7955}
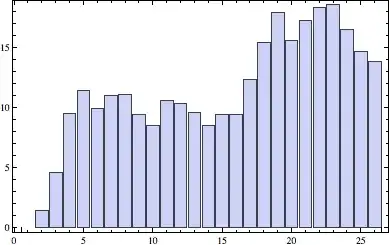
BarChart[test, Frame -> True]
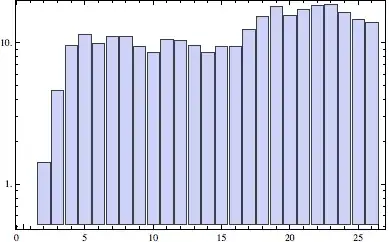
BarChart[test, ScalingFunctions -> "Log", Frame -> True]
As has been previously noted on the site, the option actually works for ListPlot and ListLinePlot (but not DateListPlot) as well, even though this fact is not documented.
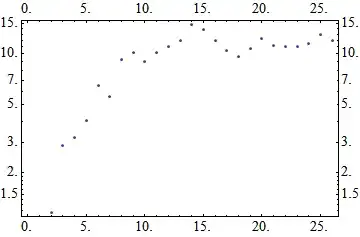
ListLinePlot[test, ScalingFunctions -> {"Log10", "Reverse"}]
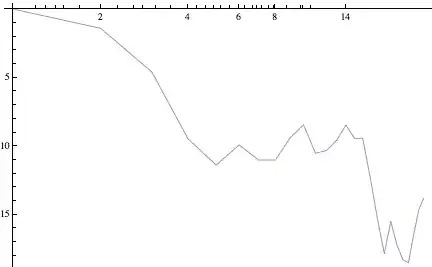
However that breaks down where there is a frame. The tick labels (FrameTicks) are now the rescaled values, not the original values. The data are correctly rescaled.
ListLinePlot[test, ScalingFunctions -> {"Log10", "Reverse"}, Frame -> True]

Obviously the undocumented insertion of this functionality into ListPlot and ListLinePlot only affected Ticks and not FrameTicks.
Is there any way to get the correct tick labels back?
Even better, is there a reasonably straightforward way to use OptionValue[ScalingFunctions] to ensure that custom tick mark placement is correct when the data have been rescaled like this?


PlotRangeit never seems to takeScalingFunctioninto account, even in the documented uses. I could imagine thatPlotRangeis used in theFrameTickscalculation. If this turns out to be too hard, maybe you can use this work-around:BarChart[test, Frame -> True, ScalingFunctions -> "Reverse", Joined -> Automatic, ChartStyle -> Directive[Red, FaceForm[], EdgeForm[]] ]However you can only applyScalingFunctionsto theyaxis here. – Jens Jun 30 '12 at 05:12ScalingFunctionin the too hard basket and went with a switch toListLogPlotand similar. – Mike Honeychurch Jun 30 '12 at 08:28