4

I have a function that returns a list containing sub-lists that have the numbers for each row in the list. (ex.{{1},{1,1},{1,2,1}}) If I was going to represent it regularly I would use table form and then center it, but I need to show the triangle rotated 90 degrees counter clockwise. Are there any good ways to do this?

Update: I found out I could use;

TableForm[{{{1}, {1, 1}, {1, 2, 1}}},TableAlignments -> Center]

Does anyone know why this works?

dirtcrazy
  • 65
  • 6

5 Answers5

2

Update:

n = 5;
sa = SparseArray[CellularAutomaton[{Total, {}, 1/2}, {{1}, 0}, n]];

satr = Block[{i = 1}, Transpose[RotateRight[#, n + 1 - i++] & /@ 
             (Riffle[#, {0}] & /@ sa) /.  0 -> ""]] ;
satr // Grid 

enter image description here


Original post:

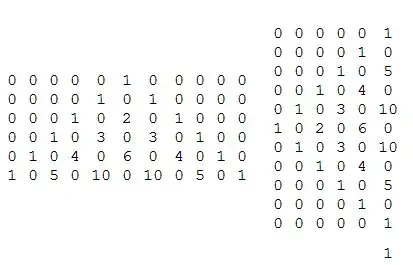
saF = SparseArray[CellularAutomaton[#, {{1}, 0}, #2]][#3] &; 
ptF = Function[{n}, saF @@@ {{{Total, {}, 1/2}, n, "NonzeroValues"}, 
       {{Unitize[#[[1]] + #[[3]]] &, {}, 1}, n, "NonzeroPositions"}}];

Row[Grid /@ {#, Transpose@#} &@SparseArray[Rule @@ Reverse[ptF[5]]], Spacer[10]]  
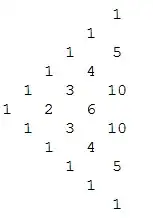
enter image description here

Remove 0s:

Row[(Grid /@ {#, Transpose@#} &@
    Normal[SparseArray[Rule @@ Reverse[ptF[5]]]] /. 0 -> ""), Spacer[10]]
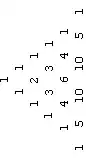
enter image description here

Graphics:

Graphics[Thread[Text @@ ({Style[#, 24, Red, Bold] & /@ #, #2} & @@ #)], 
   AspectRatio -> 3/4] &[ptF[5]]

enter image description here

Graphics[Thread[Text @@ ({Style[#, 24, Red, Bold] & /@ #, Reverse /@ #2} & @@ #)],
    AspectRatio -> 3/4] &[ptF[5]]

enter image description here

Graph:

Row[Table[Graph[Range[Length@#1], {}, VertexSize -> {.5, .5}, ImageSize -> 200,
 VertexLabels -> Thread[Range[Length@#1] -> 
                       (Placed[Style[#, 20, Red, Bold], Center] & /@ #1)],
 VertexCoordinates -> i], {i, {#2, -#2}}] & @@ ptF[5], Spacer[50]]

enter image description here

Row[Table[Graph[Range[Length@#1], {}, VertexSize -> {.5, .5}, ImageSize -> 300,
 VertexLabels -> Thread[Range[Length@#1] -> 
                       (Placed[Style[#, 20, Red, Bold], Center] & /@ #1)],
 VertexCoordinates -> i], {i, {Reverse/@#2, -Reverse/@#2}}] & @@ ptF[5], Spacer[50]]

enter image description here

kglr
  • 394,356
  • 18
  • 477
  • 896
1
rows = 5;

Rotate[Column[
  StringJoin /@ 
   Map[" " <> ToString[#] <> " " &, 
    NestList[ListConvolve[{1, 1}, #, {1, -1}, 0] &, {1}, rows], {2}], 
  Center], Pi/2]

enter image description here

Cleaner:

Row[Map[TableForm[#, TableSpacing -> 2] &, 
  NestList[ListConvolve[{1, 1}, #, {1, -1}, 0] &, {1}, rows]], " "]
ciao
  • 25,774
  • 2
  • 58
  • 139
1

Here's a Graphics approach to layout:

pascal = With[{n0 = 5},
   Table[Binomial[n, k], {n, 0, n0}, {k, 0, n}]
   ];


With[{scale = {Sqrt[3]/2, 1}, fontsize = 0.12},
 Graphics[

  MapIndexed[Text[#1, scale (#2 - {0, #2[[1]]/2})] &, pascal, {2}],

  BaseStyle -> {"TR", FontSize -> Scaled[fontsize]}, 
  PlotRangePadding -> Scaled[fontsize/2]]
 ]

Mathematica graphics

Michael E2
  • 235,386
  • 17
  • 334
  • 747
0
tab:={{1},{1,1},{1,2,1}}

tab1=Map[Rotate[#,-90\[Degree]]&,#,{2}]&@tab

tab2=TableForm[#,TableAlignments->Center]&@tab1 (*on this stage you can apply your alignment function to tab1*)

Rotate[#,90\[Degree]]&@tab2
k_v
  • 579
  • 5
  • 6
0
pascal[depth_] :=
 Module[
   {},
   Row[#, Spacer[2]] &@
     (Column[#, Center] & /@ 
       Table[
         Take[#1[[#2]], #2] & @@ {Array[Binomial, {depth, depth}, 0], i},
         {i, 1, depth}
       ]
     )
  ]

pascal[7]

Blockquote

TransferOrbit
  • 3,547
  • 13
  • 26